RNASeq数据下载处理全流程

RNASeq数据下载处理全流程

最近需要重新跑一个物种的RNASeq数据处理,所以趁此机会记录一下。ssh win10@pcrent365.com -A 22522

一、下载数据

首先在NCBI官网上选择SRA数据库,输入想要的数据关键词搜索“Zea mays drought”

image-20240415210211959

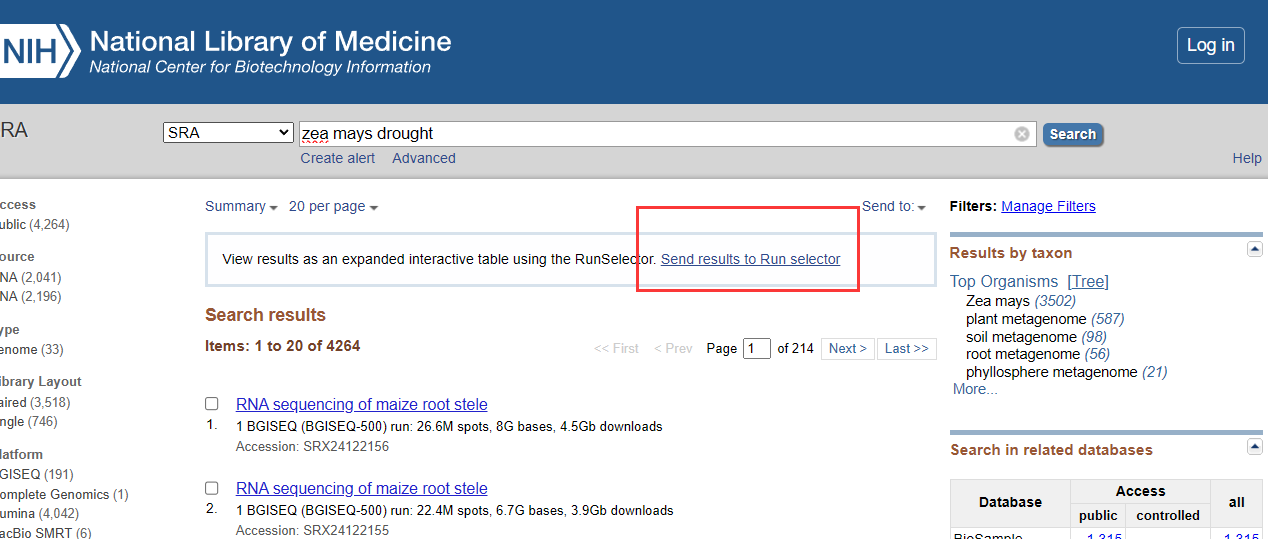
点击发送结果到数据框,点击Metadata下载SraRunTable。

接着对数据条进行筛选,可手动可写代码,看个人需求。筛选 ‘Assay Type’ 列为 ‘RNA Seq’ 的行和‘LibraryLayout’为‘PAIRED’

import pandas as pd
from icecream import install,ic
install()
def filter_rna_seq(input_file, output_file):
# 读取输入文件
df = pd.read_csv(input_file)
ic(df.shape)
ic(df.columns)
# 筛选 'Assay Type' 列为 'RNA Seq' 的行
ic(df['Assay Type'] == 'RNA Seq')
filtered_df = df[df['Assay Type'] == 'RNA-Seq']
ic(filtered_df.shape)
ic(filtered_df['LibraryLayout'].unique())
filtered_df = filtered_df[filtered_df['LibraryLayout'] == 'PAIRED']
ic(filtered_df.shape)
# 将筛选后的数据写入到输出文件
filtered_df.to_csv(output_file, index=False, sep=',', encoding='utf-8')
filter_rna_seq('/home/win/16t2/study/deep_learning/gene/RNA_Seq/SRR_download_list/Zea_Mays_SraRunTable.txt', '/home/win/16t2/study/deep_learning/gene/RNA_Seq/SRR_download_list/Zea_Mays_filter_SraRunTable.csv')

筛选完之后对srr_id生成数据下载地址

import os
import pandas as pd
url_template = "https://sra-pub-run-odp.s3.amazonaws.com/sra/{srr_id}/{srr_id}"

download_urls = []
srrid_data = pd.read_csv('/home/win/16t2/study/deep_learning/gene/RNA_Seq/SRR_download_list/Zea_Mays_filter_SraRunTable.csv')
srr_ids = srrid_data['Run']
for srr_id in srr_ids:
srr_id = srr_id.strip() # 去除每行末尾可能存在的空白字符
download_url = url_template.format(srr_id=srr_id)
download_urls.append(download_url)

# 打印或者保存到文件中
for url in download_urls:
print(url)

with open(f'/home/win/16t2/study/deep_learning/gene/RNA_Seq/SRR_download_list/zea_mays_download_urls_sra.txt', 'a') as file_out:
for url in download_urls:
file_out.write(url + '\n')

windows的话得到下载链接之后复制到迅雷下载,一次复制一千条,正常在几十Mb/s

linux下采用多线程下载,正常在400Mb/s(看网络情况),存储够的话最好是提前下载

aria2c -i "/home/win/4T/GeneDL/RNASeq/SRR/zea_mays_download_urls_sra.txt" -x 16

下载也可参考第四步在全流程里面一起做

二、参考基因组索引 建立

首先在ensembl plants数据库下载对应物种的参考基因组序列.fa和注释文件.gff3,利用hisat进行索引建立

hisat2-build -p 4 "/home/win/4T/GeneDL/RNASeq/Reference/Zea_mays.fa" Zea_mays

比对完之后,将.ht2文件放在一个文件夹Zea_mays下,后续比对需要用到这个文件夹

mv *.ht2 /home/win/4T/GeneDL/RNASeq/Reference/Zea_mays/

三、数据全流程自动处理

这里将数据下载,解压 ,比对,定量的步骤采用自动化的方式处理,需提前搭建包含parallel-fastq-dump、hisat2、samtools、featureCounts等软件。

环境配置

conda create -n rnaseq python=3.7
conda install -c bioconda hisat2
conda install parallel-fastq-dump
conda install samtools
sudo apt-get install fastp
conda install subread
pip install tqdm
pip install pandas
pip install icecream
sudo apt-get update
sudo apt-get install aria2

采用shell自动化命令

nj=8 #多少个进程
run_cmd=/mnt/d/RNASeq/src/run.pl #多线程的启动命令

dir=/mnt/d/RNASeq/data #数据路径
# data_dir=/home/win/16t2/study/deep_learning/gene/RNA_Seq/FastQ/paired
# mkdir -p ${dir}/logs #保存中间数据的目录

cat "/mnt/d/RNASeq/data/Indica_download_urls_sra.txt" > ${dir}/SRR_data.scp
#ls ${data_dir} | grep _1.fastq.gz > ${dir}/data.scp #写总的数据文件信息

nutt=$(<${dir}/SRR_data.scp wc -l) #获取多少个文件
echo $nutt
nj=$((nj<nutt?nj:nutt)) #判断文件数有没有小于线程数

split_scps=""
for n in $(seq ${nj}); do
split_scps="${split_scps} ${dir}/logs/SRR_data.scp.${n}" #获取输出文件名
echo $split_scps
done
#echo $split_scps

/home/win/16t2/study/deep_learning/gene/course_try/1Sequence/utils/split_scp.pl ${dir}/SRR_data.scp ${split_scps} #将总的文件划分成nj个子文件

${run_cmd} "JOB=1:${nj}" "${dir}/logs/process.JOB.log"\
python3 /mnt/d/RNASeq/src/RNASeq_allprocess.py ${dir}/logs/SRR_data.scp.JOB

里面的py文件内容如下

# import sys
# import shutil
# import time
# from tqdm import tqdm
# scp_path = sys.argv[1]

# with open(scp_path,'r') as f:
# lines = f.readlines()
# lines = [line.strip() for line in lines]

# for line in tqdm(lines):
# #time.sleep(0.1)
# print(f"processed {line}")
import sys
import os
import subprocess
from tqdm import tqdm
import logging
import glob
import pandas as pd
logger = logging.getLogger(__file__)
from icecream import install,ic
install()
import fnmatch
species='Zea_mays' #需与制定的参考基因组文件夹名称一致
folder_path = '/home/win10/3T/RNASeq/data'
# files = os.listdir(folder_path)
SRRdir = f'{folder_path}/SRR'
scp_path = sys.argv[1]
FastQdir = f'{folder_path}/FastQ'
SAMdir = f'{folder_path}/SAM'
BAMdir =f'{folder_path}/BAM'
Referencedir = f'{folder_path}/Reference'
Countdir = f'{folder_path}/Count'
Countlogdir = f'{folder_path}/Countlog'

with open(scp_path,'r') as f:
lines = f.readlines()
lines = [line.strip() for line in lines]

for file in lines:

SRR_id = file.split('/')[-1]
logger.info(f'process {SRR_id}')
if f'{SRR_id}_featureCounts.tsv' in os.listdir(Countdir):
ic(f'{SRR_id}已定量')
continue
if SRR_id in os.listdir(SRRdir):
ic(f'{SRR_id}已下载')
else:
cmd1 = f'aria2c {file} -d {SRRdir}'
#cmd1 = f'curl -o {SRRdir}/{SRR_id} {file}'
#cmd1 = f'wget -O {SRRdir}/{SRR_id} {file}'

#cmd1 = f'wget {file} -P {SRRdir}'
#os.system(cmd1)
subprocess.run(cmd1, shell=True, check=True)

matching_files = glob.glob(os.path.join(FastQdir, f'{SRR_id}*'))
if matching_files:
ic(f'{SRR_id}已分解')
else:
cmd2 = f'parallel-fastq-dump -t 24 -O {FastQdir} --split-3 --gzip --sra-id {SRRdir}/{SRR_id}'
#os.system(cmd2)
subprocess.run(cmd2, shell=True, check=True)

# if f'{SRR_id}.sam' in os.listdir(SAMdir):
# ic(f'{SRR_id}已比对')
# else:
# if sum(1 for filename in os.listdir(FastQdir) if fnmatch.fnmatch(filename, f"{SRR_id}*")) == 1:
# cmd4 = f'hisat2 -x {Referencedir}/{species}/{species} -p 4 -U {FastQdir}/{SRR_id}.fastq.gz -S {SAMdir}/{SRR_id}.sam'
# subprocess.run(cmd4, shell=True, check=True)
# logger.info("hisat2 end")
# else:
# cmd4 = f'hisat2 -x {Referencedir}/{species}/{species} -p 4 -1 {FastQdir}/{SRR_id}_1.fastq.gz -2 {FastQdir}/{SRR_id}_2.fastq.gz -S {SAMdir}/{SRR_id}.sam'
# subprocess.run(cmd4, shell=True, check=True)
# logger.info("hisat2 end")

# if f'{SRR_id}.bam' in os.listdir(BAMdir):
# ic(f'{SRR_id}已排序')
# else:
# cmd6 = f'samtools sort -n -@ 5 {SAMdir}/{SRR_id}.sam -o {BAMdir}/{SRR_id}.bam'
# subprocess.run(cmd6, shell=True, check=True)
# logger.info('samtools end')
if f'{SRR_id}.bam' in os.listdir(BAMdir):
logger.info(f'{SRR_id}已排序')
else:
# 检查是否有单端或双端FASTQ文件
if sum(1 for filename in os.listdir(FastQdir) if fnmatch.fnmatch(filename, f"{SRR_id}*")) == 1:
# 单端文件的情况
fastp_cmd = f'fastp -i {FastQdir}/{SRR_id}.fastq.gz -o {FastQdir}/{SRR_id}_trimmed.fastq.gz'
subprocess.run(fastp_cmd, shell=True, check=True)
cmd4 = f'hisat2 -x {Referencedir}/{species}/{species} -p 4 -U {FastQdir}/{SRR_id}_trimmed.fastq.gz | samtools sort -n -@ 5 -o {BAMdir}/{SRR_id}.bam'
else:
# 双端文件的情况
fastp_cmd = f'fastp -i {FastQdir}/{SRR_id}_1.fastq.gz -I {FastQdir}/{SRR_id}_2.fastq.gz -o {FastQdir}/{SRR_id}_1_trimmed.fastq.gz -O {FastQdir}/{SRR_id}_2_trimmed.fastq.gz'
subprocess.run(fastp_cmd, shell=True, check=True)
cmd4 = f'hisat2 -x {Referencedir}/{species}/{species} -p 4 -1 {FastQdir}/{SRR_id}_1_trimmed.fastq.gz -2 {FastQdir}/{SRR_id}_2_trimmed.fastq.gz | samtools sort -n -@ 5 -o {BAMdir}/{SRR_id}.bam'

subprocess.run(cmd4, shell=True, check=True)
logger.info("hisat2 and samtools pipeline completed")


if f'{SRR_id}_featureCounts.tsv' in os.listdir(Countdir):
ic(f'{SRR_id}已定量')
else:
if sum(1 for filename in os.listdir(FastQdir) if fnmatch.fnmatch(filename, f"{SRR_id}*")) == 1:
cmd8 = f'featureCounts -t exon -g Name \
-Q 10 --primary -s 0 -T 24 \
-a {Referencedir}/{species}.gff3 \
-o {Countdir}/{SRR_id}_featureCounts.tsv \
{BAMdir}/{SRR_id}.bam > {Countlogdir}/{SRR_id}_featureCounts.log 2>&1'
subprocess.run(cmd8, shell=True, check=True)
logger.info(f'featureCounts finished')
else:
cmd8 = f'featureCounts -t exon -g Name \
-Q 10 --primary -s 0 -T 24 \
-a {Referencedir}/{species}.gff3 \
-o {Countdir}/{SRR_id}_featureCounts.tsv \
-p {BAMdir}/{SRR_id}.bam > {Countlogdir}/{SRR_id}_featureCounts.log 2>&1'
subprocess.run(cmd8, shell=True, check=True)
logger.info(f'featureCounts finished')


cmd3 =f'rm {SRRdir}/{SRR_id}'
cmd5 = f'rm {FastQdir}/{SRR_id}*'
#cmd7 = f'rm {SAMdir}/{SRR_id}.sam'
cmd9 = f'rm {BAMdir}/{SRR_id}.bam'

#os.system(cmd3)
subprocess.run(cmd3, shell=True, check=True)
#os.system(cmd5)
subprocess.run(cmd5, shell=True, check=True)
#os.system(cmd7)
#subprocess.run(cmd7, shell=True, check=True)
#logger.info(f'rm sam finished')
#os.system(cmd9)
subprocess.run(cmd9, shell=True, check=True)
logger.info(f'rm bam finished')

logger.info(f'process {SRR_id} finished')

#HISAT2 比对速度确实很快,一个样本转录组数据比对 2G 的核糖体s RNA 参考基因组约 25 分钟,bowtie2 需要 170 分钟(线程数都是 4)。 bowtie2 的 local 模式比对出 21% 的 rRNA 污染链宴,而 HISAT2 比对 2% 的 rRNA 污染,差异也挺大的……
#但是,HISAT2 的线程数不能设置太高,用户手册中建议对人类参考基因组进行比对时,线程数设置在 1-8 之间。我用文献悉握 Transcript-level expression analysis of RNA-seq
#experiments with HISAT, StringTie and Ballgown 中的数据测试也发现当线程数超过 12 时整个比对步骤消耗的时间反而会增加。

##比对前的去接头和比对后的过滤去重???

发现问题停止运行的脚本stop.sh,如果停止运行了,要把srr,fastq,sam,bam中间文件删除,以免下一次报错

pkill -f "python3 /home/win/16t2/study/deep_learning/gene/course_try/1Sequence/RNASeq_allprocess.py"
pkill -f "/usr/bin/perl /usr/bin/hisat2"
pkill -f "sh -c '/usr/bin/hisat2-align-s'"
pkill -f "/usr/bin/hisat2-align-s --wrapper"
pkill -f "samtools sort"
pkill -f "fastq-dump"
pkill -f "/usr/bin/fastq-dump"

四、定量文件拼接与数据标准化

将定量出的tsv文件进行拼接以及转为FPKM


#-------------------------------------拼接各个tsv脚本---------------------------------------------
import pandas as pd
import os
from icecream import install,ic
install()
from tqdm import tqdm
# 指定你的文件夹路径
folder_path = '/home/win/16t2/study/deep_learning/gene/RNA_Seq/genecount/genecount_japonica_3400'
output_dir ='/home/win/16t2/study/deep_learning/gene/RNA_Seq/genecount/genecount_japonica_3400_df'
species = 'Oryza_japonica'
# 初始化用于合并所有文件的DataFrame,此时还不添加数据
merged_df = pd.DataFrame()

# 遍历指定文件夹查找TSV文件
for filename in tqdm(os.listdir(folder_path)):
if filename.endswith('.tsv'):
file_path = os.path.join(folder_path, filename)

# 假设文件有标头,根据实际情况读取Geneid和Length列,以及第七列
# 这里我们假设标头分别是Geneid,Length,...,根据需要调整列名或列索引
df = pd.read_csv(file_path, sep='\t', skiprows=1, header=None)
df.columns = ['Geneid', 'Unknown1', 'Start', 'End', 'Strand', 'Length', 'Count']
#df = pd.read_csv(file_path, sep='\t', usecols=['Geneid', 'Length', 6])
#ic(df)
# 文件名命名新列,假设文件名为‘sample_1.tsv’,分割后取‘sample’
new_column_name = filename.split('_')[0]

# 如果是第一个文件,初始化merged_df
if merged_df.empty:
merged_df['Geneid'] = df['Geneid']
merged_df['Length'] = df['Length']
merged_df[new_column_name] = df.iloc[:, 6] # 添加第七列(此时是df的第3列)
else:
# 将后续文件的第七列添加到merged_df中,匹配Geneid
# 假设Geneid完全匹配,直接添加新列
merged_df[new_column_name] = df.iloc[:, 6]

# 检查结果
print(merged_df)
merged_df = merged_df.iloc[1:,:]
output_path = f'{output_dir}/genecount_{species}.pkl'
# 使用to_pickle方法保存DataFrames
merged_df.to_pickle(output_path)

#-------------------------------------生成表达矩阵和基因长度文件------------------------------------
import pandas as pd

# 读取CSV文件
df = pd.read_pickle(output_path) #pd.read_csv('/mnt/h/study/deep_learning/gene/RNA_Seq/genecount/drought_samplecount.csv')

# 创建一个新的DataFrame来保存gene_id和gene_length
lengths_df = df.iloc[:, :2] # 选择前两列
lengths_df.columns = ['FEATURE_ID', 'GENE_LENGTHS'] # 更改列名

# 保存第一列和第二列为新的CSV文件
lengths_df.to_pickle(f'{output_dir}/lengths.pkl')

# 为了转置剩余的列(除了第二列外),先删除第二列
exp_df = df.drop(df.columns[1], axis=1) # 删除第二列

# 转置剩余列
#exp_df_transposed = exp_df.T # 只转置第二列之后的数据
exp_df.rename(columns={exp_df.columns[0]: 'FEATURE_ID'}, inplace=True)
# 保存转置后的DataFrame到CSV
print(exp_df)
feature_id = exp_df.iloc[:,0]
exp_df = exp_df.iloc[:,1:]

exp_df.to_pickle(f'{output_dir}/exp.pkl')
#ic(exp_df)
#-------------------------------------标准化------------------------------------

import pandas as pd
from icecream import install,ic
install()
# Load the expression counts data (assuming it's in CSV format)
# The DataFrame should have genes as rows and samples as columns
exp_counts_df = pd.read_pickle(f'{output_dir}/exp.pkl')
#exp_counts_df = exp_counts_df.iloc[:,1:]
# Load the gene lengths data
lengths_df = pd.read_pickle(f'{output_dir}/lengths.pkl')
lengths_df = lengths_df.iloc[:,1:]
#ic(lengths_df)
#ic(exp_counts_df.shape,lengths_df.shape,lengths_df.values.squeeze().shape)
# --- 计算 CPM ---
# Sum the counts for each sample (column) to get the total counts
total_counts_per_sample = exp_counts_df.sum(axis=0)
#ic(total_counts_per_sample)
# Divide each count by the total counts and multiply by one million
cpm_df = exp_counts_df.divide(total_counts_per_sample, axis=1) * 10**6

# --- 计算 FPKM ---
# Divide the counts by the lengths of the genes to get counts per kilobase
# lengths_df.values.squeeze() converts the DataFrame to a single column array
# The lengths are assumed to be in base pairs, so we divide by 1,000 to convert to kilobases
ic(exp_counts_df)
ic(lengths_df)
# 显示数据类型
ic(lengths_df.dtypes)
# 输出所有可能非数值的行
ic(lengths_df[pd.to_numeric(lengths_df.squeeze(), errors='coerce').isna()])
lengths_df = lengths_df.apply(pd.to_numeric, errors='coerce')
# 再次检查数据
ic(lengths_df.dtypes)
exp_counts_df = exp_counts_df.apply(pd.to_numeric, errors='coerce')
counts_per_kb = exp_counts_df.divide(lengths_df['GENE_LENGTHS'] / 10**3, axis=0)

# Then divide by the total counts (in millions) to get FPKM
fpkm_df = counts_per_kb.divide(total_counts_per_sample / 10**6, axis=1)

# --- 计算 TPM ---
# First, get the per million scaling factor
# Divide counts per kb (from the FPKM calculation step) by the total counts per sample
per_million_scaling_factor = counts_per_kb.divide(total_counts_per_sample, axis=1).sum(axis=0)

# Divide counts per kb by the per million scaling factor, and then normalize by multiplying by one million
tpm_df = counts_per_kb.divide(per_million_scaling_factor, axis=1) * 10**6

# Save the CPM, FPKM, and TPM data to new CSV files
cpm_df.to_pickle(f'{output_dir}/exp_cpm_transcript_{species}.pkl')
fpkm_df.to_pickle(f'{output_dir}/exp_fpkm_transcript_{species}.pkl')
tpm_df.to_pickle(f'{output_dir}/exp_tpm_transcript_{species}.pkl')


#----------------------------------------转录本和基因名转换-----------------------------------------------------

import pandas as pd

# 加载数据
df = pd.read_pickle(f'{output_dir}/exp_fpkm_transcript_{species}.pkl')
ic(feature_id)
df.insert(0, 'FEATURE_ID', feature_id)
# 选择 FEATURE_ID 以 "Os" 开头的行
df = df[df['FEATURE_ID'].str.startswith('Os')]

# 删掉 FEATURE_ID 中第一个 "-" 字符后面的所有字符
df['FEATURE_ID'] = df['FEATURE_ID'].apply(lambda x: x.split('-')[0])

# 将 FEATURE_ID 中的 "t" 字符替换为 "g"
df['FEATURE_ID'] = df['FEATURE_ID'].str.replace('t', 'g', n=1)

# 将 FEATURE_ID 相同的所有行相加合并为一行
df_grouped = df.groupby('FEATURE_ID').sum().reset_index()

# 保存处理后的数据
df_grouped.to_pickle(f'{output_dir}/exp_fpkm_gene_{species}.pkl')

#------------------------------------------------批次效应校正-------------------------------------------------------
import scanpy as sc
import pandas as pd
from icecream import install,ic
install()
# 1. 读取 CSV 文件
input_filepath = f'{output_dir}/exp_fpkm_gene_{species}.pkl'
df = pd.read_pickle(input_filepath)

# 2. 转置 DataFrame
df_transposed = df.transpose()
ic(df_transposed.shape)
ic(df_transposed.iloc[0,:])

df_transposed.columns = df_transposed.iloc[0,:]
# 步骤2: 删除原来的第0行
df_transposed = df_transposed.drop(index='FEATURE_ID')
#-------------------------------------拼接各个tsv脚本---------------------------------------------
import pandas as pd
import os
from icecream import install,ic
install()
from tqdm import tqdm
# 指定你的文件夹路径
folder_path = '/home/win/16t2/study/deep_learning/gene/RNA_Seq/genecount/Zeamays_Count'
output_dir ='/home/win/16t2/study/deep_learning/gene/RNA_Seq/genecount/out_table'
species = 'Zeamays'
japonica_csv1134_path='/home/win/16t2/study/deep_learning/gene/RNA_Seq/genecount/genecount_japonica_1134/exp.csv'
japonica_csv1134 = pd.read_csv(japonica_csv1134_path)
japonica_csv1134.columns =[str(i).split('/')[-1].split('.')[0] for i in japonica_csv1134.columns]
#ic(japonica_csv1134.shape)
# 初始化用于合并所有文件的DataFrame,此时还不添加数据
merged_df = pd.DataFrame()

# 遍历指定文件夹查找TSV文件
for filename in tqdm(os.listdir(folder_path)):
if filename.endswith('.tsv'):
file_path = os.path.join(folder_path, filename)

# 假设文件有标头,根据实际情况读取Geneid和Length列,以及第七列
# 这里我们假设标头分别是Geneid,Length,...,根据需要调整列名或列索引
df = pd.read_csv(file_path, sep='\t', skiprows=1, header=None)
df.columns = ['Geneid', 'Unknown1', 'Start', 'End', 'Strand', 'Length', 'Count']
#df = pd.read_csv(file_path, sep='\t', usecols=['Geneid', 'Length', 6])
#ic(df)
# 文件名命名新列,假设文件名为‘sample_1.tsv’,分割后取‘sample’
new_column_name = filename.split('_')[0]

# 如果是第一个文件,初始化merged_df
if merged_df.empty:
merged_df['Geneid'] = df['Geneid']
merged_df['Length'] = df['Length']
merged_df[new_column_name] = df.iloc[:, 6] # 添加第七列(此时是df的第3列)
else:
# 将后续文件的第七列添加到merged_df中,匹配Geneid
# 假设Geneid完全匹配,直接添加新列
merged_df[new_column_name] = df.iloc[:, 6]

if species == 'Oryza_japonica':
merged_df = pd.concat([merged_df,japonica_csv1134.iloc[:,6:]], axis=1)


# 检查结果
#ic(merged_df.shape)
merged_df = merged_df.iloc[1:,:]
output_path = f'{output_dir}/genecount_{species}.pkl'
# 使用to_pickle方法保存DataFrames
merged_df.to_pickle(output_path)

# #-------------------------------------生成表达矩阵和基因长度文件------------------------------------
import pandas as pd

# # 读取CSV文件
df = pd.read_pickle(output_path) #pd.read_csv('/mnt/h/study/deep_learning/gene/RNA_Seq/genecount/drought_samplecount.csv')

# 创建一个新的DataFrame来保存gene_id和gene_length
lengths_df = df.iloc[:, :2] # 选择前两列
lengths_df.columns = ['FEATURE_ID', 'GENE_LENGTHS'] # 更改列名

# 保存第一列和第二列为新的CSV文件
lengths_df.to_pickle(f'{output_dir}/lengths.pkl')

# 为了转置剩余的列(除了第二列外),先删除第二列
exp_df = df.drop(df.columns[1], axis=1) # 删除第二列

# 转置剩余列
#exp_df_transposed = exp_df.T # 只转置第二列之后的数据
exp_df.rename(columns={exp_df.columns[0]: 'FEATURE_ID'}, inplace=True)
# 保存转置后的DataFrame到CSV
#print(exp_df)
feature_id = exp_df.iloc[:,0]
exp_df = exp_df.iloc[:,1:]

exp_df.to_pickle(f'{output_dir}/exp.pkl')
#ic(exp_df)
#-------------------------------------标准化------------------------------------

import pandas as pd
from icecream import install,ic
install()
# Load the expression counts data (assuming it's in CSV format)
# The DataFrame should have genes as rows and samples as columns
exp_counts_df = pd.read_pickle(f'{output_dir}/exp.pkl')
#feature_id = exp_counts_df.iloc[:,0]
exp_counts_df = exp_counts_df.fillna(0)
exp_counts_df = exp_counts_df.astype(int)

#exp_counts_df = exp_counts_df.iloc[:,1:]
# Load the gene lengths data
#ic(exp_counts_df)
lengths_df = pd.read_pickle(f'{output_dir}/lengths.pkl')
lengths_df = lengths_df.iloc[:,1:]
#ic(lengths_df)
#ic(exp_counts_df.shape,lengths_df.shape,lengths_df.values.squeeze().shape)
# --- 计算 CPM ---
# Sum the counts for each sample (column) to get the total counts
total_counts_per_sample = exp_counts_df.sum(axis=0)
#ic(total_counts_per_sample)
# Divide each count by the total counts and multiply by one million
cpm_df = exp_counts_df.divide(total_counts_per_sample, axis=1) * 10**6

# --- 计算 FPKM ---
# Divide the counts by the lengths of the genes to get counts per kilobase
# lengths_df.values.squeeze() converts the DataFrame to a single column array
# The lengths are assumed to be in base pairs, so we divide by 1,000 to convert to kilobases
#ic(exp_counts_df)
#ic(lengths_df)
# 显示数据类型
#ic(lengths_df.dtypes)
# 输出所有可能非数值的行
#ic(lengths_df[pd.to_numeric(lengths_df.squeeze(), errors='coerce').isna()])
lengths_df = lengths_df.apply(pd.to_numeric, errors='coerce')
# 再次检查数据
#ic(lengths_df.dtypes)
exp_counts_df = exp_counts_df.apply(pd.to_numeric, errors='coerce')
counts_per_kb = exp_counts_df.divide(lengths_df['GENE_LENGTHS'] / 10**3, axis=0)

# Then divide by the total counts (in millions) to get FPKM
fpkm_df = counts_per_kb.divide(total_counts_per_sample / 10**6, axis=1)

# --- 计算 TPM ---
# First, get the per million scaling factor
# Divide counts per kb (from the FPKM calculation step) by the total counts per sample
per_million_scaling_factor = counts_per_kb.divide(total_counts_per_sample, axis=1).sum(axis=0)

# Divide counts per kb by the per million scaling factor, and then normalize by multiplying by one million
tpm_df = counts_per_kb.divide(per_million_scaling_factor, axis=1) * 10**6

ic(cpm_df.shape)
ic(fpkm_df.shape)
ic(tpm_df.shape)
# Save the CPM, FPKM, and TPM data to new CSV files
cpm_df.to_pickle(f'{output_dir}/exp_cpm_transcript_{species}.pkl')
fpkm_df.to_pickle(f'{output_dir}/exp_fpkm_transcript_{species}.pkl')
tpm_df.to_pickle(f'{output_dir}/exp_tpm_transcript_{species}.pkl')


#----------------------------------------转录本和基因名转换-----------------------------------------------------

import pandas as pd

if species=='Oryza_japonica':
# 加载数据
df = pd.read_pickle(f'{output_dir}/exp_fpkm_transcript_{species}.pkl')
#ic(feature_id)
df.insert(0, 'FEATURE_ID', feature_id)
ic(df['FEATURE_ID'])
# 选择 FEATURE_ID 以 "Os" 开头的行
df = df[df['FEATURE_ID'].str.startswith('Os')]
# 删掉 FEATURE_ID 中第一个 "-" 字符后面的所有字符
df['FEATURE_ID'] = df['FEATURE_ID'].apply(lambda x: x.split('-')[0])
# 将 FEATURE_ID 中的 "t" 字符替换为 "g"
df['FEATURE_ID'] = df['FEATURE_ID'].str.replace('t', 'g', n=1)
ic(df['FEATURE_ID'])
# 将 FEATURE_ID 相同的所有行相加合并为一行
df_grouped = df.groupby('FEATURE_ID').sum().reset_index()
ic(df_grouped.shape)
# 保存处理后的数据
df_grouped.to_pickle(f'{output_dir}/exp_fpkm_gene_{species}.pkl')
elif species=='Oryza_indica':
# 加载数据
df = pd.read_pickle(f'{output_dir}/exp_fpkm_transcript_{species}.pkl')
#ic(feature_id)
df.insert(0, 'FEATURE_ID', feature_id)
# 选择 FEATURE_ID 以 "Os" 开头的行
df = df[df['FEATURE_ID'].str.startswith('BGIOSGA')]
# 删掉 FEATURE_ID 中第一个 "-" 字符后面的所有字符
df['FEATURE_ID'] = df['FEATURE_ID'].apply(lambda x: x.split('-')[0])
#ic(df['FEATURE_ID'])
# 将 FEATURE_ID 中的 "t" 字符替换为 "g"
#df['FEATURE_ID'] = df['FEATURE_ID'].str.replace('t', 'g', n=1)
# 将 FEATURE_ID 相同的所有行相加合并为一行
df_grouped = df.groupby('FEATURE_ID').sum().reset_index()
ic(df_grouped.shape)
# 保存处理后的数据
df_grouped.to_pickle(f'{output_dir}/exp_fpkm_gene_{species}.pkl')
elif species=='Zeamays':
# 加载数据
df = pd.read_pickle(f'{output_dir}/exp_fpkm_transcript_{species}.pkl')
#ic(feature_id)
df.insert(0, 'FEATURE_ID', feature_id)
# 选择 FEATURE_ID 以 "Os" 开头的行
df = df[df['FEATURE_ID'].str.startswith('Zm')]
# 删掉 FEATURE_ID 中第一个 "-" 字符后面的所有字符
df['FEATURE_ID'] = df['FEATURE_ID'].apply(lambda x: x.split('_')[0])
#ic(df['FEATURE_ID'])
# 将 FEATURE_ID 中的 "t" 字符替换为 "g"
#df['FEATURE_ID'] = df['FEATURE_ID'].str.replace('t', 'g', n=1)
# 将 FEATURE_ID 相同的所有行相加合并为一行
df_grouped = df.groupby('FEATURE_ID').sum().reset_index()
ic(df_grouped.shape)
# 保存处理后的数据
df_grouped.to_pickle(f'{output_dir}/exp_fpkm_gene_{species}.pkl')

#------------------------------------------------批次效应校正-------------------------------------------------------
import scanpy as sc
import pandas as pd
import numpy as np
from icecream import install,ic
install()
# 1. 读取 CSV 文件
input_filepath = f'{output_dir}/exp_fpkm_gene_{species}.pkl'
df = pd.read_pickle(input_filepath)

# 2. 转置 DataFrame
df_transposed = df.transpose()
#ic(df_transposed.shape)
#ic(df_transposed.iloc[0,:])

df_transposed.columns = df_transposed.iloc[0,:]
# 步骤2: 删除原来的第0行
df_transposed = df_transposed.drop(index='FEATURE_ID')
#ic(df_transposed.shape)
# 3. 生成批次信息列
# 提取样本名中的 'SRR' 后的前三个数字
#ic(df_transposed)
# batch_info = df_transposed.index
# batch_info = pd.DataFrame([str(i)[:6] for i in batch_info])


batch_info = df_transposed.index.to_series().str[:6]

#ic(batch_info)
# 创建一个唯一的批次号对应每个不同的标识
batch_info = batch_info.astype('category').cat.codes + 1 # 用整数编码类别并从 1 开始编码

# 为转置的 DataFrame 添加批次信息列
df_transposed['batch'] = batch_info.values # 注:不改变原始 index
#ic(df_transposed)
# 4. 创建 AnnData 对象
# adata = sc.AnnData(df_transposed)
# adata.obs['batch'] = batch_info.values # 添加批次到.obs属性

# # 保存转置前的列名(样本名)以备后用
# original_column_names = df.columns

# # 5. 使用 scanpy 进行批次效应校正
# sc.pp.combat(adata, key='batch')

# # 6. 校正后的数据转置并保存为 CSV 文件
# corrected_df = adata.X.transpose()[:,:-1] # 最后含有batch维度,所以多了一维
# ic(corrected_df)
# ic(df)
# # 创建输出 DataFrame,确保列名(样本名)和行名(基因名)与原始数据相符
# ic(corrected_df.shape,df.index.shape,original_column_names.shape)
# corrected_df = pd.DataFrame(corrected_df, index=df.index, columns=original_column_names)
# output_filepath = f'{output_dir}/batch_corrected_exp_fpkm_gene_{species}.pkl'
# corrected_df.to_pickle(output_filepath)


#-------------------------可视化画图,看批次效应是否明显------------------------
import matplotlib.pyplot as plt
from sklearn.decomposition import PCA
from sklearn.preprocessing import StandardScaler
import numpy as np

# 假设 df_transposed 和 batch_info 已经定义好了

# 标准化数据(重要步骤,由于 PCA 对数据的尺度敏感)
scaler = StandardScaler()
df_scaled = scaler.fit_transform(df_transposed.drop('batch', axis=1))

# 初始化 PCA 类
pca = PCA(n_components=2) # 选择仅计算前两个主成分

# 挨个对每个批次的数据进行 PCA 分析
batch_unique = batch_info.unique()
fig, ax = plt.subplots(figsize=(8, 6))

for batch in batch_unique:
# 选择当前批次的数据
batch_indices = df_transposed['batch'] == batch
batch_data = df_scaled[batch_indices, :]

if batch_data.shape[0] < 2:
print(f"Batch {batch} has less than 2 samples, skipping...")
continue

# 对当前批次的数据进行 PCA
pca_result = pca.fit_transform(batch_data)

# 绘制 PCA 结果
ax.scatter(pca_result[:, 0], pca_result[:, 1], label=f'Batch {batch}', alpha=0.5)

# 添加图形元素
ax.set_xlabel('PCA 1')
ax.set_ylabel('PCA 2')
ax.set_title('PCA of Gene Expression Data by Batch')
ax.legend()
plt.tight_layout()

# 保存图像
plt.savefig(f'{output_dir}/{species}_pca_by_batch.png')

#从图中来看,批次效应不明显,故不用批次效应校正

五、将数据从一个服务器传到另一个服务器

#进 在本地服务器运行  前面是本地服务器地址,后面是远端服务器    出---相对于本地
rsync -avz -e "ssh -p 21822" "/home/win/4T/GeneDL/RNASeq/Count" win10@pcrent365.com:/home/win10/3T/RNASeq/data/
rsync -avz -e "ssh -p 2222" /home/user/data/ user@192.168.1.2:/home/user/backup/
#出 在本地服务器运行 前面是远端服务器地址,后面是本地服务器 进---相对于本地
rsync -avz -e "ssh -p 21822" win10@pcrent365.com:/home/win10/3T/RNASeq/data/ "/home/win/4T/GeneDL/RNASeq/Count"

六、差异表达、富集分析、WGCNA分析

差异分析代码

import omicverse as ov
import pandas as pd
import numpy as np
import scanpy as sc
import matplotlib.pyplot as plt
import seaborn as sns
from icecream import install,ic
install()
import pickle
sc.settings.verbosity = 3 # verbosity: errors (0), warnings (1), info (2), hints (3)
sc.settings.set_figure_params(dpi=80, facecolor='white')
species="indica"
test=0
if test==1:
exp_datapath="/home/win/4T/GeneDL/OSDrought_GCNAT_Link/data/japonica_1134/RNASeq/Train_validation_test/ExpressionData_unique_networkfilter.csv"
else:
exp_datapath= f"/home/win/4T/GeneDL/OSDrought_GCNAT_Link/data/multispecies/TF_regulation_filter_data/{species}/ExpressionData_unique_networkfilter.pkl"#

gene_file=pd.read_csv(("/home/win/4T/GeneDL/OSDrought_GCNAT_Link/data/multispecies/TF_regulation_filter_data/zeamays/ALL_Genefile.csv"))
#ov.utils.download_geneid_annotation_pair()
#data=pd.read_csv('https://raw.githubusercontent.com/Starlitnightly/omicverse/master/sample/counts.txt',index_col=0,sep='\t',header=1)
ref_data=pd.read_csv('/home/win/4T/GeneDL/OSDrought_GCNAT_Link/data/japonica_1134/RNASeq/DEG_data.csv') #count数据
ic(ref_data)
if test==1:
data=ref_data
else:
with open(f'/home/win/4T/GeneDL/OSDrought_GCNAT_Link/data/multispecies/TF_regulation_filter_data/{species}/label_sample_genecount.pkl','rb') as fp:
data=pickle.load(fp)
ic(data)
new_columns = data.iloc[0]
data.columns = new_columns
data = data.iloc[1:].copy() # 跳过第一行数据
data = data.astype({col: int for col in data.columns[1:]}) # 除了第一列外的列转换为int类型
# 重置索引,这里直接在构造新DataFrame时避免了不必要的操作,因为新DataFrame默认已有连续的索引
data.reset_index(drop=True, inplace=True)
#data.set_index(data.columns[0], inplace=True)

counter = {}
new_columns = []
for col in data.columns:
counter[col] = counter.get(col, 0) + 1
new_col_name = f"{col}.{counter[col]}" if counter[col] > 1 else col
new_columns.append(new_col_name)
#data.columns = new_columns
#ic(new_columns)
data=pd.DataFrame(data.values,index=list(data.index),columns=new_columns)
ic(data.shape)

data.iloc[:,1:] = data.iloc[:,1:].astype('float') + 1e-16

ic(data)

#data = data[data['FEATURE_ID'].isin(gene_file['Gene'])]
ic(data.shape)

'''示例数据格式 count数据
GeneID,CD,CD,CD,CD,CD
Os01g0100100,521,762,833,672
Os01g0100200,1,0,0,2,0,0,0
'''

cd_columns = data.filter(like='CD', axis=1)
ck_columns = data.filter(like='CK', axis=1)
ce_columns = data.filter(like='CE', axis=1)

if test==0:
cd_columns.reset_index(inplace=True)
ck_columns.reset_index(inplace=True)
ce_columns.reset_index(inplace=True)
cd_columns.drop(columns=cd_columns.columns[0], inplace=True)
ck_columns.drop(columns=ck_columns.columns[0], inplace=True)
ce_columns.drop(columns=ce_columns.columns[0], inplace=True)

#ic(ck_columns,cd_columns)
#ic(cd_columns.shape,ck_columns.shape,ce_columns.shape)
deg_data_ck_cd = pd.concat([ck_columns, cd_columns], axis=1).astype(float)
deg_data_ck_ce = pd.concat([ck_columns, ce_columns], axis=1).astype(float)
deg_data_cd_ce = pd.concat([cd_columns, ce_columns], axis=1).astype(float)

dds_ck_cd=ov.bulk.pyDEG(deg_data_ck_cd)
dds_ck_cd.drop_duplicates_index()
print('... drop_duplicates_index success')
dds_ck_cd.normalize()
print('... estimateSizeFactors and normalize success')

dds_ck_ce=ov.bulk.pyDEG(deg_data_ck_ce)
dds_ck_ce.drop_duplicates_index()
print('... drop_duplicates_index success')
dds_ck_ce.normalize()
print('... estimateSizeFactors and normalize success')

dds_cd_ce=ov.bulk.pyDEG(deg_data_cd_ce)
dds_cd_ce.drop_duplicates_index()
print('... drop_duplicates_index success')
dds_cd_ce.normalize()
print('... estimateSizeFactors and normalize success')

# cd_columns = cd_columns.astype('float16')
# ce_columns = ce_columns.astype('float16')
# ck_columns = ck_columns.astype('float16')
# ic(cd_columns,ck_columns,ce_columns)
treatment_groups_cd=cd_columns.columns#.tolist()
treatment_groups_ce=ce_columns.columns#.tolist()
control_groups_ck=ck_columns.columns#.tolist()
ic(treatment_groups_cd,treatment_groups_ce,control_groups_ck)
#ic(dds_ck_cd)
result_ck_cd=dds_ck_cd.deg_analysis(treatment_groups_cd,control_groups_ck,method='ttest')
#ic(result_ck_cd)
result_ck_cd = pd.DataFrame(result_ck_cd)
combined_df_ck_cd = pd.concat([data.iloc[:, [0]], result_ck_cd], axis=1)

result_ck_ce=dds_ck_ce.deg_analysis(treatment_groups_ce,control_groups_ck,method='ttest')
result_ck_ce = pd.DataFrame(result_ck_ce)
combined_df_ck_ce = pd.concat([ data.iloc[:, [0]], result_ck_ce], axis=1)

result_cd_ce=dds_cd_ce.deg_analysis(treatment_groups_cd,treatment_groups_ce,method='ttest')
result_cd_ce = pd.DataFrame(result_cd_ce)
combined_df_cd_ce = pd.concat([ data.iloc[:, [0]], result_cd_ce], axis=1)

def label_data(row):
if row['sig'] == 'sig' and row['log2FC'] > 0:
return 1
elif row['sig'] == 'sig' and row['log2FC'] < 0:
return -1
else:
return 0

# 在 df 上应用该函数,并将结果赋给 'Label' 列
combined_df_ck_cd['Label'] = combined_df_ck_cd.apply(label_data, axis=1)
if test==1:
exp_data = pd.read_csv(f'{exp_datapath}')
else:
with open(f'{exp_datapath}','rb') as fp:
exp_data=pickle.load(fp)

exp_data['Label'] =combined_df_ck_cd.apply(label_data, axis=1)
combined_df_ck_cd.to_csv(f'/home/win/4T/GeneDL/OSDrought_GCNAT_Link/plot/multispecies_DEG/{species}_CK_CD_DEG_output.csv',index=False)

df = combined_df_ck_cd
df['-log10pvalue'] = -np.log10(df['pvalue'])
# 筛选-log10pvalue大于0.05的行,并进一步筛选出abs(log2FC) > 0.585的行
#selected_genes = df[(df['-log10pvalue'] > 0.05) & (df['log2FC'].abs() > 0.585)]
selected_genes_up = df[(df['pvalue'] < 0.05) & (df['log2FC'] > 2)]
selected_genes_up.to_csv(f'/home/win/4T/GeneDL/OSDrought_GCNAT_Link/plot/multispecies_DEG/{species}_CK_CD_DEG_up.csv',index=False)
selected_genes_down = df[(df['pvalue'] < 0.05) & (df['log2FC'] < -2)]
selected_genes_down.to_csv(f'/home/win/4T/GeneDL/OSDrought_GCNAT_Link/plot/multispecies_DEG/{species}_CK_CD_DEG_down.csv',index=False)

# 根据abs(log2FC)降序排列
#sorted_genes = selected_genes.sort_values(by='abs(log2FC)', key=abs, ascending=False)
#sorted_genes.to_csv(f'/home/win/4T/GeneDL/OSDrought_GCNAT_Link/plot/multispecies_DEG/{species}_CK_CD_DEG_ascending.csv',index=False)
# 计数log2FC为正数的行(上调基因)
# upregulated_genes_count = sorted_genes[sorted_genes['log2FC'] > 0].shape[0]
# # 计数log2FC为负数的行(下调基因)
# downregulated_genes_count = sorted_genes[sorted_genes['log2FC'] < 0].shape[0]
# 打印结果
print(f"上调基因数量:{len(selected_genes_up)}")
print(f"下调基因数量:{len(selected_genes_down)}")


combined_df_ck_ce['Label'] = combined_df_ck_ce.apply(label_data, axis=1)
# exp_data = pd.read_csv('/home/win/4T/GeneDL/OSDrought_GCNAT_Link/data/RNASeq/Train_validation_test/ExpressionData_unique_networkfilter.csv')
# exp_data['Label'] =combined_df_ck_ce.apply(label_data, axis=1)
combined_df_ck_ce.to_csv(f'/home/win/4T/GeneDL/OSDrought_GCNAT_Link/plot/multispecies_DEG/{species}_CK_CE_DEG_output.csv',index=False)

df = combined_df_ck_ce
df['-log10pvalue'] = -np.log10(df['pvalue'])
# 筛选-log10pvalue大于0.05的行,并进一步筛选出abs(log2FC) > 0.585的行
selected_genes_up = df[(df['pvalue'] < 0.05) & (df['log2FC'] > 2)]
selected_genes_up.to_csv(f'/home/win/4T/GeneDL/OSDrought_GCNAT_Link/plot/multispecies_DEG/{species}_CK_CE_DEG_up.csv',index=False)
selected_genes_down = df[(df['pvalue'] < 0.05) & (df['log2FC'] < -2)]
selected_genes_down.to_csv(f'/home/win/4T/GeneDL/OSDrought_GCNAT_Link/plot/multispecies_DEG/{species}_CK_CE_DEG_down.csv',index=False)

# 根据abs(log2FC)降序排列
#sorted_genes = selected_genes.sort_values(by='abs(log2FC)', key=abs, ascending=False)
#sorted_genes.to_csv(f'/home/win/4T/GeneDL/OSDrought_GCNAT_Link/plot/multispecies_DEG/{species}_CK_CD_DEG_ascending.csv',index=False)
# 计数log2FC为正数的行(上调基因)
# upregulated_genes_count = sorted_genes[sorted_genes['log2FC'] > 0].shape[0]
# # 计数log2FC为负数的行(下调基因)
# downregulated_genes_count = sorted_genes[sorted_genes['log2FC'] < 0].shape[0]
# 打印结果
print(f"上调基因数量:{len(selected_genes_up)}")
print(f"下调基因数量:{len(selected_genes_down)}")


combined_df_cd_ce['Label'] = combined_df_cd_ce.apply(label_data, axis=1)
# exp_data = pd.read_csv('/home/win/4T/GeneDL/OSDrought_GCNAT_Link/data/RNASeq/Train_validation_test/ExpressionData_unique_networkfilter.csv')
# exp_data['Label'] =combined_df_ck_ce.apply(label_data, axis=1)
combined_df_cd_ce.to_csv(f'/home/win/4T/GeneDL/OSDrought_GCNAT_Link/plot/multispecies_DEG/{species}_CD_CE_DEG_output.csv',index=False)

df = combined_df_cd_ce
df['-log10pvalue'] = -np.log10(df['pvalue'])
# 筛选-log10pvalue大于0.05的行,并进一步筛选出abs(log2FC) > 0.585的行
#selected_genes = df[(df['-log10pvalue'] > 0.05) & (df['log2FC'].abs() > 0.585)]
# 根据abs(log2FC)降序排列
selected_genes_up = df[(df['pvalue'] < 0.05) & (df['log2FC'] > 2)]
selected_genes_up.to_csv(f'/home/win/4T/GeneDL/OSDrought_GCNAT_Link/plot/multispecies_DEG/{species}_CD_CE_DEG_up.csv',index=False)
selected_genes_down = df[(df['pvalue'] < 0.05) & (df['log2FC'] < -2)]
selected_genes_down.to_csv(f'/home/win/4T/GeneDL/OSDrought_GCNAT_Link/plot/multispecies_DEG/{species}_CD_CE_DEG_down.csv',index=False)

# 根据abs(log2FC)降序排列
#sorted_genes = selected_genes.sort_values(by='abs(log2FC)', key=abs, ascending=False)
#sorted_genes.to_csv(f'/home/win/4T/GeneDL/OSDrought_GCNAT_Link/plot/multispecies_DEG/{species}_CK_CD_DEG_ascending.csv',index=False)
# 计数log2FC为正数的行(上调基因)
# upregulated_genes_count = sorted_genes[sorted_genes['log2FC'] > 0].shape[0]
# # 计数log2FC为负数的行(下调基因)
# downregulated_genes_count = sorted_genes[sorted_genes['log2FC'] < 0].shape[0]
# 打印结果
print(f"上调基因数量:{len(selected_genes_up)}")
print(f"下调基因数量:{len(selected_genes_down)}")


exp_data.to_csv(f'/home/win/4T/GeneDL/OSDrought_GCNAT_Link/plot/multispecies_DEG/{species}_ExpressionData_geneclassification.csv',index=False)


# ic(result.head())
# print(result.shape)
# result=result.loc[result['log2(BaseMean)']>1]
# print(result.shape)
#-1 means automatically calculates
# dds.foldchange_set(fc_threshold=-1,
# pval_threshold=0.05,
# logp_max=6)
# dds.plot_volcano(title='DEG Analysis',figsize=(4,4),
# plot_genes_num=8,plot_genes_fontsize=12,)
# plt.savefig('/mnt/g/gene/course_try/Omicverse/out/DEG_Analysis.png',bbox_inches='tight')
# dds.plot_boxplot(genes=['Os12t0152900-01-E5','Os06t0230301-00-E1'],treatment_groups=treatment_groups,
# control_groups=control_groups,figsize=(2,3),fontsize=12,
# legend_bbox=(2,0.55))
# plt.savefig('/mnt/g/gene/course_try/Omicverse/out/Ckap2_Lef1.png',bbox_inches='tight')
# dds.plot_boxplot(genes=['Os12t0152900-01-E5'],treatment_groups=treatment_groups,
# control_groups=control_groups,figsize=(2,3),fontsize=12,
# legend_bbox=(2,0.55))
# plt.savefig('/mnt/g/gene/course_try/Omicverse/out/Ckap2.png',bbox_inches='tight')

富集分析代码GO

import gseapy as gp
import os
from plot_new import barplot, dotplot
import pandas as pd
import matplotlib.pyplot as plt
from icecream import install,ic
install()
plt.rcParams['font.sans-serif']=['Times New Roman']
plt.rcParams['mathtext.fontset'] = 'stix'#和Times new roman 最像

#-------------------------------获取Geneid和GOterm---------------------------------------------------
# 假设文件是以制表符分隔的,将 'sep' 参数替换成 ',' 如果是逗号分隔的CSV
#species='zeamays'
species='japonica'
#file_path = '/home/win/4T/GeneDL/OSDrought_GCNAT_Link/data/multispecies/initial_data/zeamays/Zma_GO_annotation'
file_path ='/home/win/4T/GeneDL/OSDrought_GCNAT_Link/data/japonica_1134/GOcluster/Osj_GO_annotation' # 或者 'Osj_GO_annotation.csv'

# 读取文件,只获取前两列
# header参数假设文件有标题行,如果没有请设定为None
GO_term_data = pd.read_csv(file_path, sep='\t', usecols=[0, 2,3], header=0)
if species=='zeamays':
relation = []
# 使用open函数和with语句读取文件
with open("/home/win/4T/GeneDL/OSDrought_GCNAT_Link/data/multispecies/initial_data/zeamays/gene_id_trans.txt", 'r') as file:
for line in file:
# 分割每行的数据,只取前两个值(原始基因名和第一个映射基因名)
parts = line.strip().split('\t')
if len(parts) >= 2: # 确保有足够的部分读取
original_gene = parts[0]
mapped_gene = parts[1]
# 保存结果
relation.append([original_gene, mapped_gene])

# 将列表转换为DataFrame
df3 = pd.DataFrame(relation, columns=['Original Gene', 'Mapped Gene'])
# 创建映射字典
gene_id_map = pd.Series(df3['Mapped Gene'].values, index=df3['Original Gene'].values).to_dict()
#ic(gene_id_map)
#GO_term_data['zeaGeneid'] = GO_term_data['Gene_id'].apply(convert_msu_to_rap)
# 替换 column1, column2, column3 中的基因名
GO_term_data['zeaGeneid'] = GO_term_data['Gene_id'].map(gene_id_map).fillna(GO_term_data['Gene_id']) # fillna用于保留未找到映射的原始值
# relation={}
# for i in open("/home/win/4T/GeneDL/OSDrought_GCNAT_Link/data/multispecies/initial_data/zeamays/gene_id_trans.txt"):
# rap=str(i.split()[0])
# msu=str(i.split()[1])
# #ic(rap)
# #ic(msu)
# if msu!="None":
# if " " in msu:
# for a in msu.split(" "):
# relation[a] = rap
# else:
# relation[msu] = rap
# #ic(relation)

# # 转换函数: 如果找不到对应的MSU标识符,则返回原RAP标识符
# def convert_rap_to_msu(rap_id):
# return relation.get(rap_id, rap_id)
# def convert_msu_to_rap(msu_id):
# return relation.get(msu_id,None)

#GO_term_data['zeaGeneid'] = GO_term_data['Gene_id'].apply(convert_msu_to_rap)

def create_gene_sets(df):
"""
基于DataFrame创建基因集字典。DataFrame应包含两列:GO_term和OSGeneid。

:param df: 包含GO_term和OSGeneid的DataFrame。
:return: 基因集字典,键是GO_term,值是OSGeneid列表。
"""
gene_sets = {}
grouped = df.groupby('GO_term')

for name, group in grouped:
gene_sets[name] = group['zeaGeneid'].tolist()
return gene_sets
else:
relation={}
for i in open("/home/win/4T/GeneDL/OSDrought_GCNAT_Link/data_proceed/MSU2RAP/RAP-MSU_2018-03-29.txt"):
rap=str(i.split()[0])
msu=str(i.split()[1])
if msu!="None":
if "," in msu:
for a in msu.split(","):
relation[a[0:-2]] = rap
else:
relation[msu[0:-2]] = rap
#ic(relation)

# 转换函数: 如果找不到对应的MSU标识符,则返回原RAP标识符
def convert_rap_to_msu(rap_id):
return relation.get(rap_id, rap_id)
def convert_msu_to_rap(msu_id):
return relation.get(msu_id, msu_id)

GO_term_data['OSGeneid'] = GO_term_data['Gene_id'].apply(convert_rap_to_msu)

def create_gene_sets(df):
"""
基于DataFrame创建基因集字典。DataFrame应包含两列:GO_term和OSGeneid。

:param df: 包含GO_term和OSGeneid的DataFrame。
:return: 基因集字典,键是GO_term,值是OSGeneid列表。
"""
gene_sets = {}
grouped = df.groupby('GO_term')

for name, group in grouped:
gene_sets[name] = group['OSGeneid'].tolist()

return gene_sets
#ic(len(GO_term_data['Gene_id'].unique()))
#ic(GO_term_data)
#ic(GO_term_data[GO_term_data['zeaGeneid'].notna()]['zeaGeneid'])
grouped_dataframes = {aspect: group for aspect, group in GO_term_data.groupby('Aspect')}


all_gene_sets=[]
for aspect, sub_df in grouped_dataframes.items():
ic(f"Aspect: {aspect}")
ic(sub_df)

gene_sets=create_gene_sets(sub_df)
for key in gene_sets.keys():
gene_sets[key] = [item for item in gene_sets[key] if item != 'None']
all_gene_sets.append(gene_sets)
#ic(gene_sets)
# max_len = max(len(lst) for lst in gene_sets.values())
# for key in gene_sets.keys():
# gene_sets[key].extend([None] * (max_len - len(gene_sets[key])))
# df = pd.DataFrame(gene_sets)
# df.T.to_csv('/mnt/e/GeneDL/OSDrought_GCNAT_Link/plot/data/GO_term_output.csv', index=True)
#ic(gene_sets)
#自己创建基因集gene_sets={'term_A':['gene1', 'gene2',...],
# 'term_B':['gene2', 'gene4',...], ...}
# # # gene_sets = 'KEGG_2016'
data_list=['CK_CD',
'CK_CE',
'CD_CE',
]
#gene_sets=['KEGG_2016','KEGG_2013']

# from bioservices import KEGG
# kegg = KEGG()
# # 查询特定物种的某个通路
# pathway_info = kegg.get_pathway_by_gene("Os03g0719850", "osa")
# print(pathway_info)
# # 或下载通路图
# kegg.save_pathway("path:osa00010", filename="pathway_image.png")
funcs=['CC','MF','BP']
label=['up','down']
colors=['#2e86de','#c0392b','#28b463']
for cla in label:
for data_name in data_list:
all_results=[]
for i,gene_sets in enumerate(all_gene_sets):
data = pd.read_csv(f'/home/win/4T/GeneDL/OSDrought_GCNAT_Link/plot/multispecies_DEG/{species}_{data_name}_DEG_{cla}.csv')#['DAB2IP', 'AKT1', 'ARNT', 'FLCN', 'XRCC6', 'BTG1', 'STAT1', 'STAT1']
#ic(data)
#data = data[data['sig'] == 'sig']
#ic(data)
gene_list = data['FEATURE_ID']#[:5000]##['GeneID']
gene_list = [str(i) for i in gene_list]
#gene_list = pd.read_csv('/home/win/4T/GeneDL/OSDrought_GCNAT_Link/plot/data/top_diff_CD_CE_degree.csv')
#gene_list = list(gene_list)
#gene_list = gene_list['0'].apply(convert_msu_to_rap)
# ic(gene_list)
# ic(gene_sets)
# GO富集
enr = gp.enrichr(gene_list=gene_list,#所需查询gene_list,可以是一个列表,也可为文件(一列,每行一个基因)
gene_sets= gene_sets,#['GO_Biological_Process_2018'],#,#gene set library,多个相关的gene set 。如所有GO term组成一个gene set library.
#organism='rice',#持(human, mouse, yeast, fly, fish, worm), 自定义gene_set 则无影响。
#description='kegg',#工作运行描述
outdir=f'/home/win/4T/GeneDL/OSDrought_GCNAT_Link/plot/multispecies_enrichr/GO/{species}_{data_name}_{cla}',#输出目录
top_term=20,
cutoff=0.9,#pvalue阈值
)
ic(enr.results)
#all_results.append(enr.results)
dot_png = f"{species}_{data_name}_{cla}_{funcs[i]}" + "_" + "dot" + ".png"
bar_png = f"{species}_{data_name}_{cla}_{funcs[i]}" + "_" + "bar" + ".png"
base_path = "/home/win/4T/GeneDL/OSDrought_GCNAT_Link/plot/multispecies_enrichr/funcGO"

if os.path.exists(base_path+dot_png):
os.remove(base_path+dot_png)

#fig, axs = plt.subplots(nrows=3, ncols=1, figsize=(5, 10))
cut=0.6
df= dotplot(enr.results,
column="Adjusted P-value",
size=5,
#figsize=(3,5),
xticklabels_rot=45,
title=f'GO Top10 Pathway {species} {data_name} {cla} {funcs[i]}',
show_ring=True,
#marker='o',
cmap='RdBu',
top_term=10, legend="r",pval=0.9,
ofname=base_path+dot_png,
cutoff=cut,
)
if os.path.exists(base_path+bar_png):
os.remove(base_path+bar_png)

ax = barplot(enr.results,
column="Adjusted P-value",
title=f"{species} {data_name} {cla} {funcs[i]}",
#group='Gene_set', # set group, so you could do a multi-sample/library comparsion
size=1,
top_term=10,
#figsize=(3,5),
color=colors[i],#['#27ae60', '#34495e'] , # set colors for group
ofname=base_path+bar_png,
cutoff=cut
#color = {'KEGG_2021_Human': 'salmon', 'MSigDB_Hallmark_2020':'darkblue'}
)
df = df.iloc[::-1].reset_index(drop=True)
df.to_csv(f'/home/win/4T/GeneDL/OSDrought_GCNAT_Link/plot/multispecies_enrichr/GO/{species}_{data_name}_{cla}_{funcs[i]}.csv',index=False)


# from gseapy import enrichment_map
# import numpy as np
# # return two dataframe
# ic(enr.results)
# nodes, edges = enrichment_map(enr.results,cutoff=cut,top_term=20)
# ic(edges)
# import networkx as nx
# # build graph
# G = nx.from_pandas_edgelist(edges,
# source='src_idx',
# target='targ_idx',
# edge_attr=['jaccard_coef', 'overlap_coef', 'overlap_genes'])

# fig, ax = plt.subplots()

# # init node cooridnates
# pos=nx.layout.spiral_layout(G)
# ic(pos.keys())
# #node_size = nx.get_node_attributes()
# # draw node
# nodelist = list(G)
# xy = np.asarray([pos[v] for v in nodelist])
# ic(nodelist)
# original_list = list(xy[:, 0])
# nx.draw_networkx_nodes(G,
# pos=pos,
# cmap=plt.cm.RdYlBu,
# node_color= [number * 100 for number in original_list],
# node_size= [number * 1000 for number in original_list])
# # draw node label
# ic(nodes.Term)
# ic(pos)
# node_term_dict = nodes.Term.to_dict()
# labels = {v:node_term_dict[v] for v in nodelist}
# nx.draw_networkx_labels(G,
# pos=pos,
# labels=labels)
# # draw edge
# edge_weight = nx.get_edge_attributes(G, 'jaccard_coef').values()
# nx.draw_networkx_edges(G,
# pos=pos,
# width=list(map(lambda x: x*10, edge_weight)),
# edge_color='#CDDBD4')
# #plt.show()
# plt.savefig(f'/home/win/4T/GeneDL/OSDrought_GCNAT_Link/plot/multispecies_enrichr/GO/{species}_{data_name}_{cla}_grn.png')


# ax = dotplot(enr.res2d, title='KEGG_2021_Human',cmap='viridis_r', size=10, figsize=(3,5))
# ax = barplot(enr.res2d,title='KEGG_2021_Human', figsize=(4, 5), color='darkred')
#barplot(enr.res2d, title='CK_CD_degree',top_term=20,ofname=base_path+bar_png,)

富集分析代码KEGG

import gseapy as gp
import os
#from gseapy.plot import barplot, dotplot
from plot_new import barplot, dotplot
import pandas as pd
import matplotlib.pyplot as plt
from icecream import install,ic
install()
plt.rcParams['font.sans-serif']=['Times New Roman']
#-------------------------------获取Geneid和GOterm---------------------------------------------------
import json
import re
species='japonica'
basepath='/home/win/4T/GeneDL/OSDrought_GCNAT_Link/plot/multispecies_enrichr/KEGG/'
with open(f"{basepath}/{species}/kegg.json") as f:
ko_map_data = json.load(f)

with open(f"{basepath}/{species}/KEGG_pathway_ko.txt", "w") as oh:
line = "level1_pathway_id\tlevel1_pathway_name\tlevel2_pathway_id\tlevel2_pathway_name"
line += "\tlevel3_pathway_id\tlevel3_pathway_name\tko\tko_name\tko_des\tec\n"
oh.write(line)
for level1 in ko_map_data["children"]:
m = re.match(r"(\S+)\s+([\S\w\s]+)", level1["name"])
level1_pathway_id = m.groups()[0].strip()
level1_pathway_name = m.groups()[1].strip()
for level2 in level1["children"]:
m = re.match(r"(\S+)\s+([\S\w\s]+)", level2["name"])
level2_pathway_id = m.groups()[0].strip()
level2_pathway_name = m.groups()[1].strip()
for level3 in level2["children"]:
m = re.match(r"(\S+)\s+([^\[]*)", level3["name"])
level3_pathway_id = m.groups()[0].strip()
level3_pathway_name = m.groups()[1].strip()

if "children" in level3:
for ko in level3["children"]:
if species=='zeamays':
pattern = r"(\S+)\s+([\S\s]+?);\s*([\S\s]*?)(?:\[EC:(\S+)\])*"
m = re.match(pattern, ko["name"])
if m:
ko_id = m.group(1).strip()
ko_des = m.group(2).strip()
ko_name = ko_id
ec = m.group(4) if m.group(4) else "-"
line = level1_pathway_id + "\t" + level1_pathway_name + "\t" + level2_pathway_id + "\t" + level2_pathway_name
line += "\t" + level3_pathway_id + "\t" + level3_pathway_name + "\t" + ko_id + "\t" + ko_name + "\t" + ko_des + "\t" + ec + "\n"
oh.write(line)
else:
m = re.match(r"(\S+)\s+(\S+);\s+([^\[]+)\s*(\[EC:\S+(?:\s+[^\[\]]+)*\])*", ko["name"])
#ic(m)
if m is not None:
ko_id = m.groups()[0].strip()
ko_name = m.groups()[1].strip()
ko_des = m.groups()[2].strip()
ec = m.groups()[3]
if ec==None:
ec = "-"
line = level1_pathway_id + "\t" + level1_pathway_name + "\t" + level2_pathway_id + "\t" + level2_pathway_name
line += "\t" + level3_pathway_id + "\t" + level3_pathway_name + "\t" + ko_id + "\t" + ko_name + "\t" + ko_des + "\t" + ec + "\n"
oh.write(line)


import pandas as pd

data = pd.read_csv(f"{basepath}/{species}/KEGG_pathway_ko.txt", sep="\t",dtype=str)

data = data.drop_duplicates()

data.to_csv(f"{basepath}/{species}/KEGG_pathway_ko_uniq.csv", index=False)

file_path = f'{basepath}/{species}/KEGG_pathway_ko_uniq.csv'
# 读取CSV文件中的特定两列
df = pd.read_csv(file_path, usecols=['level3_pathway_id', 'ko'])
ic(len(df['level3_pathway_id'].unique()))
ic(df)
if species=='zeamays':
#df['ko'].to_csv('/home/win/4T/GeneDL/OSDrought_GCNAT_Link/plot/multispecies_enrichr/KEGG/zeamays/entre_id.csv',index=False)
mapdata=pd.read_csv('/home/win/4T/GeneDL/OSDrought_GCNAT_Link/plot/multispecies_enrichr/KEGG/zeamays/stableid_entreid.txt',sep='\t')
ic(mapdata)
new_df = mapdata[['Gene stable ID', 'NCBI gene (formerly Entrezgene) ID']].drop_duplicates()
mapping = pd.Series(new_df['Gene stable ID'].values, index=new_df['NCBI gene (formerly Entrezgene) ID']).to_dict()
df['ko'] = df['ko'].map(mapping)
ic(df['ko'])

pd.DataFrame(df['level3_pathway_id'].unique()).to_csv(f'{basepath}/{species}/unique_kegg_term.csv',index=False)
# 初始化基因集字典
gene_sets = {}
# 遍历DataFrame来构建基因集字典
for index, row in df.iterrows():
# 从当前行获取pathway ID和KO基因ID
pathway_id = row['level3_pathway_id']
ko_gene = row['ko']
# 如果pathway ID已经在字典中,添加KO基因到对应的列表中
# 否则,在字典中创建新的pathway ID键,并添加KO基因
if pathway_id in gene_sets:
# 假设一个pathway可以有多个相同的ko基因,我们不重复添加
if ko_gene not in gene_sets[pathway_id]:
gene_sets[pathway_id].append(ko_gene)
else:
# 创建新键,初始化为包含当前KO基因的列表
gene_sets[pathway_id] = [ko_gene]


label=['up','down']
data_list=['CK_CD',
'CK_CE',
'CD_CE',
]
colors=['#2e86de','#c0392b','#28b463']
for cla in label:
for i,data_name in enumerate(data_list):
all_results=[]
data = pd.read_csv(f'/home/win/4T/GeneDL/OSDrought_GCNAT_Link/plot/multispecies_DEG/{species}_{data_name}_DEG_{cla}.csv')
#ic(data)
#data = data[data['sig'] == 'sig']
#ic(data)
gene_list = data['FEATURE_ID']#[:5000]##['GeneID']
gene_list = [str(i) for i in gene_list]
#gene_list = pd.read_csv('/home/win/4T/GeneDL/OSDrought_GCNAT_Link/plot/data/top_diff_CD_CE_degree.csv')
#gene_list = list(gene_list)
#gene_list = gene_list['0'].apply(convert_msu_to_rap)
# ic(gene_list)
# ic(gene_sets)
# GO富集
enr = gp.enrichr(gene_list=gene_list,#所需查询gene_list,可以是一个列表,也可为文件(一列,每行一个基因)
gene_sets= gene_sets,#['GO_Biological_Process_2018'],#,#gene set library,多个相关的gene set 。如所有GO term组成一个gene set library.
#organism='rice',#持(human, mouse, yeast, fly, fish, worm), 自定义gene_set 则无影响。
#description='kegg',#工作运行描述
outdir=f'/home/win/4T/GeneDL/OSDrought_GCNAT_Link/plot/multispecies_enrichr/KEGG/{species}/{species}_{data_name}_{cla}',#输出目录
top_term=20,
cutoff=0.9,#pvalue阈值
)
ic(enr.results)
#all_results.append(enr.results)
dot_png = f"{species}_{data_name}_{cla}" + "_" + "dot" + ".png"
bar_png = f"{species}_{data_name}_{cla}" + "_" + "bar" + ".png"
base_path = f"/home/win/4T/GeneDL/OSDrought_GCNAT_Link/plot/multispecies_enrichr/KEGG/{species}/funcKEGG"

if os.path.exists(base_path+dot_png):
os.remove(base_path+dot_png)

#fig, axs = plt.subplots(nrows=3, ncols=1, figsize=(5, 10))
cut=0.6
df= dotplot(enr.results,
column="Adjusted P-value",
size=5,
#figsize=(3,5),
xticklabels_rot=45,
title=f'GO Top10 Pathway {species} {data_name} {cla}',
show_ring=True,
#marker='o',
cmap='RdBu',
top_term=10, legend="r",pval=0.9,
ofname=base_path+dot_png,
cutoff=cut,
)
if os.path.exists(base_path+bar_png):
os.remove(base_path+bar_png)

ax = barplot(enr.results,
column="Adjusted P-value",
title=f"{species} {data_name} {cla}",
#group='Gene_set', # set group, so you could do a multi-sample/library comparsion
size=1,
top_term=10,
#figsize=(3,5),
color=colors[i],#['#27ae60', '#34495e'] , # set colors for group
ofname=base_path+bar_png,
cutoff=cut
#color = {'KEGG_2021_Human': 'salmon', 'MSigDB_Hallmark_2020':'darkblue'}
)
df = df.iloc[::-1].reset_index(drop=True)
df.to_csv(f'/home/win/4T/GeneDL/OSDrought_GCNAT_Link/plot/multispecies_enrichr/KEGG/{species}/{species}_{data_name}_{cla}.csv',index=False)


# from gseapy import enrichment_map
# import numpy as np
# # return two dataframe
# ic(enr.results)
# nodes, edges = enrichment_map(enr.results,cutoff=cut,top_term=20)
# ic(edges)
# import networkx as nx
# # build graph
# G = nx.from_pandas_edgelist(edges,
# source='src_idx',
# target='targ_idx',
# edge_attr=['jaccard_coef', 'overlap_coef', 'overlap_genes'])

# fig, ax = plt.subplots()

# # init node cooridnates
# pos=nx.layout.spiral_layout(G)
# ic(pos.keys())
# #node_size = nx.get_node_attributes()
# # draw node
# nodelist = list(G)
# xy = np.asarray([pos[v] for v in nodelist])
# ic(nodelist)
# original_list = list(xy[:, 0])
# nx.draw_networkx_nodes(G,
# pos=pos,
# cmap=plt.cm.RdYlBu,
# node_color= [number * 100 for number in original_list],
# node_size= [number * 1000 for number in original_list])
# # draw node label
# ic(nodes.Term)
# ic(pos)
# node_term_dict = nodes.Term.to_dict()
# labels = {v:node_term_dict[v] for v in nodelist}
# nx.draw_networkx_labels(G,
# pos=pos,
# labels=labels)
# # draw edge
# edge_weight = nx.get_edge_attributes(G, 'jaccard_coef').values()
# nx.draw_networkx_edges(G,
# pos=pos,
# width=list(map(lambda x: x*10, edge_weight)),
# edge_color='#CDDBD4')
# #plt.show()
# plt.savefig(f'/home/win/4T/GeneDL/OSDrought_GCNAT_Link/plot/multispecies_enrichr/KEGG/{data_name}_kegg_grn.png')

WGCNA分析R

#Rscript script_name.R arg1 arg2
# install.packages("devtools", repos='https://cran.r-project.org')
# devtools::install_version("ggplot2", version="2.2.1")
# install.packages("optparse", repos='https://cran.r-project.org')
# install.packages("jsonlite", repos='https://cran.r-project.org')
# install.packages('amap', repos='https://cran.r-project.org')
# install.packages("dendextend", repos='https://cran.r-project.org')
# install.packages("WGCNA", repos='https://cran.r-project.org')

library(optparse)
option_list <- list(
make_option(c("-i", "--infile"), type = "character", default = '/pub1/data/mg_projects/projects/web_script/tool_runing/8ed926747e04570e4a5345bfa133185b/input.json',
action = "store", help = "Input a exp file path!"
),
make_option(c("-o", "--outfile"), type = "character", default = '/pub1/data/mg_projects/projects/web_script/web_file_catche/runing/dae42f7681eca28355c6ba9105a3b5ff',
action = "store", help = "Input a outfolder path!"
)
)
logs=c()

tryCatch({
Args <- commandArgs()
opt = parse_args(OptionParser(option_list = option_list, usage = "Data press"))
#logs=c(logs,paste0('geting data:',paste0(paste0(names(opt),'=',opt),collapse = ',')))
logs=c(logs,paste0('run wgcna.R-',basename(opt$outfile)))

library(jsonlite)
data<-jsonlite::stream_in(file(opt$infile),pagesize = 1000)

#exp_path='/pub1/data/user_data/13456826965/GSE1561/GSE1561_GPL96_sample_exp.txt'
#geneMode='mad'
#geneModeValue='50'
#sampleCut='1'
#netType='unsigned'
#geneModeValue=as.numeric(geneModeValue)
#outFolder='/pub1/data/mg_projects/projects/web_script/tool_runing/test_data/WGCNA1'
#minModuleSize=30
#deepSplit=4
#mergeCutHeight=0.5

#oldFolder='/pub1/data/mg_projects/projects/web_script/tool_runing/test_data/WGCNA'
method=unlist(data$method)#'cli'#module
#cliDatas=list()
#list(A=list(name:xxx,sample:c(),value:c()),B=list())
oldFolder=unlist(data$oldFolder)

library('amap')
library(dendextend)
getTreeNode=function(hc_obj){
dend=as.dendrogram(hc_obj)
capture.output(str(dend))->stx2
#write.table(stx,row.names = F,col.names = F ,paste0(outFolder,'/wgcna_dissTOM_tree.text'))
gsub('^ \\s+','',stx2)->stx2
nodeMap=rbind()
leafs=rbind()
all_node_obj=rbind()
for(i in length(stx2):1){
# i=length(stx2)
#i=547
if(length(grep('--leaf',stx2[i]))==0){
h=unlist(stringr::str_split(stx2[i],'members at h = '))[2]
h=gsub(']','',h)
lefNode=unlist(stringr::str_split(stx2[i],' members at h = '))[1]
lefNode=unlist(stringr::str_split(lefNode,'branches and '))[2]
sub1=paste0('C',i+1)
all_node_obj[which(all_node_obj[,1]==paste0('C',i+1)),4]=paste0('C',i)
#sub2=all_node_obj[which(all_node_obj[,4]==''),1]
for(j in 1:nrow(all_node_obj)){
#t.ind=which(all_node_obj[,1]==paste0('C',i+j+1))
#if(length(t.ind))
sub_mx=all_node_obj[which(all_node_obj[,1]==paste0('C',i+j+1)),]
if(sub_mx[4]==''){
sub2=sub_mx[1]
break()
}
}
all_node_obj[which(all_node_obj[,1]==sub2),4]=paste0('C',i)
#all_node_obj=c(all_node_obj,list(Node=paste0('C',i),H=h,Members=lefNode,subNode1=paste0('C',i+1),subNode12=''))
all_node_obj=rbind(all_node_obj,c(paste0('C',i),sub1,sub2,'',lefNode))
nodeMap=rbind(nodeMap,c('',paste0('C',i),paste0('C',i+1),sub2,h))
}else{
node=gsub(' ','',unlist(stringr::str_split(stx2[i],'--leaf'))[2])
node=gsub('^ \\s+','',node)
node=gsub('\\s+ $','',node)
node=gsub('^"','',node)
node=gsub('"$','',node)
#node=colnames(adjacency)[as.numeric(node)]
leafs=rbind(leafs,c(node,paste0('C',i)))
all_node_obj=rbind(all_node_obj,c(paste0('C',i),'','','',1))
nodeMap=rbind(nodeMap,c(node,paste0('C',i),'','',0))
}
}
#all_node_obj[all_node_obj[,4]=='',]
#sort(leafs[,1])[1:10]
od=rep(nrow(nodeMap),nrow(nodeMap))
od[match(leafs[,1],nodeMap[,1])]=nrow(leafs):1
nodeMap=nodeMap[order(od),]
return(nodeMap)
}

getTreeNode_backup=function(hc_obj){
dend=as.dendrogram(hc_obj)
dend_label=partition_leaves(dend)
dend_height=get_nodes_attr(dend,'height')
nodeMap=rbind()
for(i in length(dend_height):1){
cls=dend_label[[i]]
node1=paste0(cls,collapse = '\t')
snode1=''
snode2=''
if(length(cls)>1){
node1=openssl::md5(node1)
snode1=paste0('C',i+1)
node2_ts=dend_label[[i+1]]
cls1=cls[which(!cls%in%node2_ts)]
node2=paste0(cls1,collapse = '\t')
if(length(cls1)>1){
node2=openssl::md5(node2)
}
snode2=nodeMap[which(nodeMap[,1]==node2),2]
}
nodeMap=rbind(nodeMap,c(node1,paste0('C',i),snode1,snode2,dend_height[i]))
}
od=rep(10000000,nrow(nodeMap))
od[match(hc_obj$labels[hc_obj$order],nodeMap[,1])]=1:length(hc_obj$labels)
nodeMap=nodeMap[order(od),]
nodeMap[which(nodeMap[,3]!=''),1]=''
#head(nodeMap)
#head(nodeMap1)
#sum(nodeMap1[,1]==nodeMap1[,1])
#nodeMap1[which(nodeMap1[,3]!=''),1]
return(nodeMap)
}
getClusterTree=function(exp,dMethod='euclidean',hMethod='complete'){
cNames=colnames(exp)
colnames(exp)=paste0('C',1:ncol(exp))
hc=hcluster(t(exp),method =dMethod,link=hMethod )
nodeMap=getTreeNode(hc)
nodeMap2=getTreeNode_backup(hc)
#dim(nodeMap1)
#head(nodeMap1)
sum(nodeMap2[,2]==nodeMap[,2])
sum(nodeMap2[,1]==nodeMap[,1])
sum(nodeMap2[,4]==nodeMap[,4])
cbind(nodeMap2[which(nodeMap2[,4]!=nodeMap[,4]),],nodeMap[which(nodeMap2[,4]!=nodeMap[,4]),])

#dim(nodeMap)
nodeMap[,1]=cNames[match(nodeMap[,1],colnames(exp))]
nodeMap[is.na(nodeMap[,1]),1]=''
#nodeMap[which(nodeMap[,3]!=''),1]
#head(exp)
#dend=as.dendrogram(hc)
#dend_label=partition_leaves(dend)
#dend_height=get_nodes_attr(dend,'height')
#nodeMap=rbind()
#for(i in length(dend_height):1){
# cls=dend_label[[i]]
# node1=paste0(cls,collapse = '\t')
# snode1=''
# snode2=''
# if(length(cls)>1){
# node1=openssl::md5(node1)
# snode1=paste0('C',i+1)
# node2_ts=dend_label[[i+1]]
# cls1=cls[which(!cls%in%node2_ts)]
# node2=paste0(cls1,collapse = '\t')
# if(length(cls1)>1){
# node2=openssl::md5(node2)
# }
# snode2=nodeMap[which(nodeMap[,1]==node2),2]
# }
# nodeMap=rbind(nodeMap,c(node1,paste0('C',i),snode1,snode2,dend_height[i]))
#}
#od=rep(10000000,nrow(nodeMap))
#od[match(hc$labels[hc$order],nodeMap[,1])]=1:length(hc$labels)
#nodeMap=nodeMap[order(od),]
#nodeMap[which(nodeMap[,3]!=''),1]=''
#head(nodeMap)
#head(nodeMap1)
#sum(nodeMap1[,1]==nodeMap1[,1])
#nodeMap1[which(nodeMap1[,3]!=''),1]
#head(nodeMap)
return(nodeMap)
}

library(WGCNA)

if(method=='module'){

exp_path=unlist(data$exp_path)
geneMode=paste0(as.character(unlist(data$geneMode)),'')
geneModeValue=unlist(data$geneModeValue)
sampleCut=unlist(data$sampleCut)
netType=unlist(data$netType)
outFolder=opt$outfile
minModuleSize=unlist(data$minModuleSize)
deepSplit=unlist(data$deepSplit)
oldFolder=unlist(data$oldFolder)
mergeCutHeight=unlist(data$mergeCutHeight)

geneModeValue=as.numeric(geneModeValue)

if(oldFolder!=''&oldFolder!=outFolder&file.exists(paste0(oldFolder,'/wgcna_TOM.RData'))){
load(paste0(oldFolder,'/wgcna_TOM.RData'))
file.copy(paste0(oldFolder,'/wgcna_pre_tree.txt'),paste0(outFolder,'/wgcna_pre_tree.txt'),overwrite = T)
file.copy(paste0(oldFolder,'/wgcna_exp_powers.txt'),paste0(outFolder,'/wgcna_exp_powers.txt'),overwrite = T)
file.copy(paste0(oldFolder,'/wgcna_exp_data.txt'),paste0(outFolder,'/wgcna_exp_data.txt'),overwrite = T)
file.copy(paste0(oldFolder,'/wgcna_dissTOM_tree.txt'),paste0(outFolder,'/wgcna_dissTOM_tree.txt'),overwrite = T)
file.copy(paste0(oldFolder,'/wgcna_module_net.fst'),paste0(outFolder,'/wgcna_module_net.fst'),overwrite = T)
file.copy(paste0(oldFolder,'/wgcna_TOM.RData'),paste0(outFolder,'/wgcna_TOM.RData'),overwrite = T)
logs=c(logs,paste0('SampleList=',paste0(row.names(filter.exp),collapse = '#,#')))
logs=c(logs,paste0('saved module network data:',paste0(cytq,collapse = ',')))
logs=c(logs,paste0('set power=',cutPower,',By sample count=',nrow(filter.exp)))
logs=c(logs,paste0('saved TOM data'))
#wgcna_module_net.fst

}else{


dat=data.table::fread(exp_path, sep = "\t",header = T,stringsAsFactors = F,check.names = F
,na.strings="NA",data.table = F)
dat=dat[match(unique(dat[,1]),dat[,1]),]
row.names(dat)=dat[,1]
dat=dat[,-1]
logs=c(logs,'filter SD=0')
sds=apply(dat, 1, sd)
dat=dat[which(sds>0),]
logs=c(logs,paste0('filtered SD=0,row=',nrow(dat),',col=',ncol(dat)))

if(geneMode=='mad'){
logs=c(logs,paste0('filter MAD>',ceiling(geneModeValue),'%'))
mads=apply(dat, 1, mad)
t_inds=which(mads>=quantile(mads,seq(0,1,0.01))[ceiling(geneModeValue)+1])
dat=dat[t_inds,]
logs=c(logs,paste0('filtered MAD,row=',nrow(dat),',col=',ncol(dat)))
}else if(geneMode=='sd'){
logs=c(logs,paste0('filter SD>',ceiling(geneModeValue),'%'))
mads=apply(dat, 1, sd)
t_inds=which(mads>=quantile(mads,seq(0,1,0.01))[ceiling(geneModeValue)+1])
dat=dat[t_inds,]
logs=c(logs,paste0('filtered SD,row=',nrow(dat),',col=',ncol(dat)))
}else if(geneMode=='mean'){
logs=c(logs,paste0('filter mean>',(geneModeValue),'%'))
mads=apply(dat, 1, mean)
t_inds=which(mads>geneModeValue)
dat=dat[t_inds,]
logs=c(logs,paste0('filtered mean,row=',nrow(dat),',col=',ncol(dat)))
}
#logs=c()
#print('=====')
filter.exp=t(dat)
dim(filter.exp)
logs=c(logs,paste0('Sample clustering'))
sTree=getClusterTree(dat,hMethod = 'average')
write.table(sTree,file = paste0(outFolder,'/wgcna_pre_tree.txt'),quote = F,row.names = F,sep = '\t')
logs=c(logs,paste0('saved sample clustered'))


gsg = goodSamplesGenes(filter.exp, verbose = 3);
#gsg$allOK
# if FALSE:
if (!gsg$allOK)
{
# Optionally, print the gene and sample names that were removed:
if (sum(!gsg$goodGenes)>0)
logs(logs,paste("Removing genes:", paste(colnames(filter.exp)[!gsg$goodGenes], collapse = ", ")));
if (sum(!gsg$goodSamples)>0)
logs(logs,paste("Removing samples:", paste(rownames(filter.exp)[!gsg$goodSamples], collapse = ", ")));
# Remove the offending genes and samples from the data:
filter.exp = filter.exp[gsg$goodSamples, gsg$goodGenes]
}
logs=c(logs,paste0('SampleFiltered sampleNum=',nrow(filter.exp),'geneNum=',ncol(filter.exp)))

#if(sampleCut=='1'){
# logs=c(logs,paste0('SampleFiltering'))
# logs=c(logs,paste0('Sample clustering'))
# sampleTree = hclust(dist(filter.exp), method = "average")

# logs=c(logs,paste0('Sample clustered'))
# q1=quantile(sampleTree$height, c(0,0.25, 0.5, 0.75,1), na.rm=T)
# otl=1.5*(q1[4]-q1[2])
# otl.u=ifelse(q1[4]+otl>q1[5],q1[5],q1[4]+otl)
# otl.d=ifelse(q1[2]-otl<q1[1],q1[1],q1[2]-otl)
# logs=c(logs,paste0('SampleFiltering,outlier upper=',otl.u))
#outlier=which(sampleTree$height>=otl.d&sampleTree$height<=otl.u)
# ctr=cutree(sampleTree,h = otl.u+1)
# ctr.tb=table(ctr)
# outlier=match(names(which(ctr==names(ctr.tb)[which.max(ctr.tb)])),row.names(filter.exp))
# logs=c(logs,paste0('SampleFiltered sampleNum=',length(outlier)))
# filter.exp=filter.exp[outlier,]
#}

write.table(cbind(Tag=colnames(filter.exp),t(filter.exp)),file = paste0(outFolder,'/wgcna_exp_data.txt'),quote = F,row.names = F,sep = '\t')
logs=c(logs,paste0('SampleList=',paste0(row.names(filter.exp),collapse = '#,#')))

#pdf(file = paste0(MG_GENE_FOLDER,'/SampleCluster.pdf'),width = 12,height = 6)
#plot(sampleTree, main = "Sample clustering to detect outliers", sub="", xlab="")
#dev.off()
#height=140000
#print(height)
#print(min(sampleTree$height))

#print('===1')
logs=c(logs,paste0('run pickSoftThresholding'))
powers = c(c(1:10), seq(from = 12, to=30, by=2))
#print('===2')
#print(head(filter.exp))
sft = pickSoftThreshold((filter.exp), powerVector=powers,
networkType=netType, verbose=5,blockSize = 20000)
cutPower=sft$powerEstimate
logs=c(logs,paste0('run pickSoftThresholded power=',cutPower))
if(is.na(cutPower)){
if(netType=='unsigned'|netType=='signed_hybrid'){
if(nrow(filter.exp)<20){
cutPower=9
}else if(nrow(filter.exp)<30){
cutPower=8
}else if(nrow(filter.exp)<40){
cutPower=7
}else{
cutPower=6
}
}else{
if(nrow(filter.exp)<20){
cutPower=18
}else if(nrow(filter.exp)<30){
cutPower=16
}else if(nrow(filter.exp)<40){
cutPower=14
}else{
cutPower=12
}
}
}
logs=c(logs,paste0('set power=',cutPower,',By ',netType,' sample count=',nrow(filter.exp)))

sft.tab=sft$fitIndices
sft.tab$SFTR2=-sign(sft$fitIndices[,3])*sft$fitIndices[,2]
write.table(sft.tab,file = paste0(outFolder,'/wgcna_exp_powers.txt'),quote = F,row.names = F,sep = '\t')
logs=c(logs,paste0('saved powerEstimateed'))


logs=c(logs,paste0('runing adjacency'))
adjacency = adjacency(filter.exp, power = cutPower,type = netType)
logs=c(logs,paste0('runing TOMsimilarity'))
TOM = TOMsimilarity(adjacency)
colnames(TOM)=colnames(adjacency)
row.names(TOM)=row.names(adjacency)
#head(TOM[,1:10])
dissTOM = 1-TOM
plotTOM = dissTOM^7
#dim(TOM)
diag(plotTOM) = NA

#dim(adjacency)
#colnames(plotTOM)
# Call the plot function
#colnames(dissTOM)=colnames(adjacency)
#row.names(dissTOM)=colnames(adjacency)
cName_TOM=colnames(dissTOM)
rName_TOM=row.names(dissTOM)
colnames(dissTOM)=paste0('C',1:ncol(dissTOM))
row.names(dissTOM)=paste0('R',1:nrow(dissTOM))
logs=c(logs,paste0('hclust dissTOM'))
geneTree = hclust(as.dist(dissTOM), method = "average")
dim(dissTOM)


#plot(geneTree)
logs=c(logs,paste0('hclusted dissTOM'))
nodeMap=getTreeNode(geneTree)
#head(nodeMap)
nodeMap[,1]=rName_TOM[match(nodeMap[,1],row.names(dissTOM))]
nodeMap[is.na(nodeMap[,1]),1]=''
colnames(dissTOM)=cName_TOM
row.names(dissTOM)=rName_TOM
#dend=as.dendrogram(geneTree)
#capture.output(str(dend))->stx2
#write.table(stx,row.names = F,col.names = F ,paste0(outFolder,'/wgcna_dissTOM_tree.text'))
#gsub('^ \\s+','',stx2)->stx2
#nodeMap=rbind()
#leafs=rbind()
#for(i in length(stx2):1){
# i=length(stx2)
# if(length(grep('--leaf',stx2[i]))==0){
# h=unlist(stringr::str_split(stx2[i],'members at h = '))[2]
# h=gsub(']','',h)
# nodeMap=rbind(nodeMap,c('',paste0('C',i),paste0('C',i+1),paste0('C',i+2),h))
# }else{
# node=gsub(' ','',unlist(stringr::str_split(stx2[i],'--leaf'))[2])
# node=gsub('^ \\s+','',node)
# node=gsub('\\s+ $','',node)
# node=gsub('^"','',node)
# node=gsub('"$','',node)
#node=colnames(adjacency)[as.numeric(node)]
# leafs=rbind(leafs,c(node,paste0('C',i)))
# nodeMap=rbind(nodeMap,c(node,paste0('C',i),'','',0))
# }
#}
#sort(leafs[,1])[1:10]
#od=rep(nrow(nodeMap),nrow(nodeMap))
#od[match(leafs[,1],nodeMap[,1])]=nrow(leafs):1
#nodeMap=nodeMap[order(od),]
#head(nodeMap)
#geneTree$labels

#match(colnames(dissTOM)[geneTree$order],nodeMap[,1])

#which(nodeMap[,3]=='')

#print(geneTree$height)
#class(dend)
#summary(dend)
#attr(dend,x = length)
#plot(geneTree,hang = -1, cex = 0.6)
#plot(as.phylo(geneTree), type = "fan")
#dend_label=partition_leaves(dend)
#dend_height=get_nodes_attr(dend,'height')
#nodeMap=rbind()
#for(i in length(dend_height):1){
# cls=dend_label[[i]]
# node1=paste0(cls,collapse = '\t')
# snode1=''
# snode2=''
# if(length(cls)>1){
# node1=openssl::md5(node1)
# snode1=paste0('C',i+1)
# node2_ts=dend_label[[i+1]]
# cls1=cls[which(!cls%in%node2_ts)]
# node2=paste0(cls1,collapse = '\t')
# if(length(cls1)>1){
# node2=openssl::md5(node2)
# }
# snode2=nodeMap[which(nodeMap[,1]==node2),2]
# }
# nodeMap=rbind(nodeMap,c(node1,paste0('C',i),snode1,snode2,dend_height[i]))
#}
#nodeMap[which(nodeMap[,3]!=''),1]=''
#od=rep(10000,nrow(nodeMap))
#od[match(geneTree$labels[geneTree$order],nodeMap[,1])]=1:length(geneTree$labels)
#nodeMap=nodeMap[order(od),]
write.table(nodeMap,file = paste0(outFolder,'/wgcna_dissTOM_tree.txt'),quote = F,row.names = F,sep = '\t')
#head(nodeMap)
logs=c(logs,paste0('saved hclust dissTOM tree'))
logs=c(logs,paste0('exporting module network data'))
#colnames(TOM)
#row.names(TOM)
cyt = exportNetworkToCytoscape(TOM,threshold =0)
#head(cyt$edgeData)
tidyfst::export_fst(cyt$edgeData[,1:3],path = paste0(outFolder,'/wgcna_module_net.fst'))
cytq=quantile(cyt$edgeData[,3])
logs=c(logs,paste0('saved module network data:',paste0(cytq,collapse = ',')))
save(filter.exp,adjacency,dissTOM,geneTree,cytq,cutPower,file = paste0(outFolder,'/wgcna_TOM.RData'))
logs=c(logs,paste0('saved TOM data'))
}

#load(paste0('/pub1/data/mg_projects/projects/web_script/tool_runing/97d971bc04475222ec72f4a05e66910f/wgcna_TOM.RData'))

# plotDendroAndColors(geneTree,dynamicColors ,
# "Module colors",
# dendroLabels = FALSE, hang = 0.03,
# addGuide = TRUE, guideHang = 0.05)
#################cal module#################
#dim(dissTOM)
#tom_tree=readMatrix(paste0(oldFolder,'/wgcna_dissTOM_tree.txt'),row=F)
#head(tom_tree)
#setdiff(colnames(filter.exp),unique(tom_tree[,1]))[1:10]
#setdiff(unique(tom_tree[,1]),colnames(filter.exp))[1:10]

dynamicMods = cutreeDynamic(dendro = geneTree, distM = dissTOM
,deepSplit = as.numeric(deepSplit), pamRespectsDendro = FALSE,
minClusterSize = as.numeric(minModuleSize))
dynamicColors = labels2colors(dynamicMods)
#MEList = moduleEigengenes(filter.exp, colors = dynamicColors)
merge = mergeCloseModules(filter.exp, dynamicColors, cutHeight = as.numeric(mergeCutHeight), verbose = 3)
# The merged module colors
mergedColors = merge$colors
#dim(m_dat_sum)
#length(dynamicColors)
m_dat_sum=as.data.frame(table(mergedColors))
logs=c(logs,paste0('module count:',paste0(paste0(m_dat_sum[,1],'-',m_dat_sum[,2]),collapse = ',')))
write.table(m_dat_sum,file = paste0(outFolder,'/wgcna_module_summary.txt'),quote = F,row.names = F,sep = '\t')

#head(cbind(Gene=colnames(filter.exp),module=mergedColors))
write.table(cbind(Gene=colnames(filter.exp),dynamicModule=dynamicColors,mergeModule=mergedColors)
,file = paste0(outFolder,'/wgcna_module.txt'),quote = F,row.names = F,sep = '\t')
logs=c(logs,paste0('saved hclust mergedColors data'))

MEs=merge$newMEs
colnames(MEs)=gsub('^ME','',colnames(MEs))
write.table(cbind(Tag=row.names(MEs),MEs),file = paste0(outFolder,'/wgcna_MEs.txt'),quote = F,row.names = F,sep = '\t')
logs=c(logs,paste0('saved hclust ME data'))
MEDiss = 1-cor(MEs)

sTree2=getClusterTree(MEDiss,dMethod = 'pearson',hMethod = 'average')
write.table(sTree2,file = paste0(outFolder,'/wgcna_ME_tree.txt'),quote = F,row.names = F,sep = '\t')
m_inds=match(sTree2[which(sTree2[,1]!='')],colnames(MEDiss))
write.table(MEDiss[m_inds,m_inds],file = paste0(outFolder,'/wgcna_ME_tree_heat.txt'),quote = F,row.names = F,sep = '\t')
logs=c(logs,paste0('saved hclust ME tree'))
#####################Module membership########################
geneModuleMembership = as.data.frame(cor(filter.exp, MEs, use = "p"));
MMPvalue = as.data.frame(corPvalueStudent(as.matrix(geneModuleMembership), nrow(filter.exp)));
#melt(geneModuleMembership)
#colnames(geneModuleMembership)
#cbind(colnames(filter.exp),mergedColors)
mmr=reshape::melt(cbind(Tag=row.names(geneModuleMembership),geneModuleMembership),id.vars=c('Tag'))
mmp=reshape::melt(cbind(Tag=row.names(MMPvalue),MMPvalue),id.vars=c('Tag'))
mmr=mmr[paste0(mmr[,1],'\t',mmr[,2])%in%paste0(colnames(filter.exp),'\t',mergedColors),]
mmr$pvalue=mmp[match(paste0(mmr[,1],'\t',mmr[,2]),paste0(mmp[,1],'\t',mmp[,2])),3]
colnames(mmr)=c('Gene','Module','R','pvalue')
mmr=mmr[match(colnames(filter.exp),mmr[,1]),]
write.table(mmr,file = paste0(outFolder,'/wgcna_MM_value.txt'),quote = F,row.names = F,sep = '\t')
logs=c(logs,paste0('saved Module membership data'))
#mergedColors
if(!file.exists(paste0(outFolder,'/clini.json'))){
write.table('',file = paste0(outFolder,'/clini.json'),quote = F,row.names = F,sep = '\t')
}
tidyfst::export_fst(as.data.frame(cbind(Gene=colnames(filter.exp),mergeModule=mergedColors)),path = paste0(outFolder,'/wgcna_module.fst'))
tidyfst::export_fst(as.data.frame(cbind(Sample=row.names(MEs),MEs)),path = paste0(outFolder,'/wgcna_MEs.fst'))
tidyfst::export_fst(mmr,path = paste0(outFolder,'/wgcna_MM_value.fst'))
tidyfst::export_fst(as.data.frame(cbind(Sample=row.names(filter.exp),filter.exp)),path = paste0(outFolder,'/filter.exp.fst'))
logs=c(logs,paste0('saved all module data'))

}else if(method=='cli'){

outFolder=opt$outfile
cNames=unlist(data$cNames)
cTypes=unlist(data$cTypes)
cliDatas=(data$cliDatas)
oldFolder=unlist(data$oldFolder)
#cliDatas[1][[2]]

cliDatas=cliDatas[[1]]

#table(cliDatas[,4])

file.copy(opt$infile,paste0(oldFolder,'/clini.json'),overwrite = T)
#data<-jsonlite::stream_in(file(paste0(oldFolder,'/clini.json')),pagesize = 1000)

#oldFolder='/pub1/data/mg_projects/projects/web_script/tool_runing/97d971bc04475222ec72f4a05e66910f'

baseFolder=oldFolder
#geneModule=tidyfst::import_fst(paste0(baseFolder,'/wgcna_module.fst'),as.data.table = F)
mes=tidyfst::import_fst(paste0(baseFolder,'/wgcna_MEs.fst'),as.data.table = F)
#head(mes)
row.names(mes)=mes[,1]
mes=mes[,-1]
cmp=intersect(row.names(mes),cliDatas[,1])
mes=mes[match(cmp,row.names(mes)),]
cliDatas=cliDatas[match(cmp,cliDatas[,1]),]
nColNames=c()
nColSubNames=c()
nColData=cbind()
for(i in 1:length(cTypes)){
if(cTypes[i]>0){
nColNames=c(nColNames,cNames[i])
nColSubNames=c(nColSubNames,cNames[i])
nColData=cbind(nColData,cliDatas[,i+1])
}else{
dt=cliDatas[,i+1]
udt=unique(dt)
udt=udt[which(!is.na(udt)&udt!='')]
for(u in udt){
ndt=ifelse(dt==u,1,0)
ndt[which(is.na(dt))]=NA
nColData=cbind(nColData,ndt)
nColSubNames=c(nColSubNames,u)
nColNames=c(nColNames,cNames[i])
}
}
}
nColData=apply(nColData, 2, as.numeric)
#nColData=nColData[,1]
cliModuleMembership = as.data.frame(cor(mes,nColData, use = "p"));
MMPvalue = as.data.frame(corPvalueStudent(as.matrix(cliModuleMembership), nrow(mes)));
colnames(cliModuleMembership)=paste0(nColNames,'(',nColSubNames,')')
colnames(MMPvalue)=paste0(nColNames,'(',nColSubNames,')')

cNs=rbind(c(-1,'',nColNames),c(-1,'',nColSubNames))
colnames(cNs)=c('isPvalue','Module',colnames(cliModuleMembership))
cdt2=rbind(cbind(isPvalue=0,Module=row.names(cliModuleMembership),cliModuleMembership),
cbind(isPvalue=1,Module=row.names(MMPvalue),MMPvalue))
cdt2=apply(cdt2, 2,as.character)

write.table(rbind(as.data.frame(cNs),as.data.frame(cdt2)),file = paste0(baseFolder,'/wgcna_ME_cli_cor.txt')
,quote = F,row.names = F,sep = '\t')

#rbind(cliModuleMembership,MMPvalue)
#geneModule=tidyfst::import_fst(paste0(baseFolder,'/wgcna_module.fst'),as.data.table = F)
mmr=tidyfst::import_fst(paste0(baseFolder,'/wgcna_MM_value.fst'),as.data.table = F)
filter.exp=tidyfst::import_fst(paste0(baseFolder,'/filter.exp.fst'),as.data.table = F)
row.names(filter.exp)=filter.exp[,1]
filter.exp=filter.exp[,-1]
filter.exp=filter.exp[match(cmp,row.names(filter.exp)),]
#head(filter.exp[,1:10])

cliGeneMembership = as.data.frame(cor(filter.exp,nColData, use = "p"));
MMPvalue = as.data.frame(corPvalueStudent(as.matrix(cliGeneMembership), nrow(mes)));
colnames(cliGeneMembership)=paste0(nColNames,'(',nColSubNames,')')
colnames(MMPvalue)=paste0(nColNames,'(',nColSubNames,')')
#head(gs)
gs=cbind(mmr,cliGeneMembership[match(mmr[,1],row.names(cliGeneMembership)),]
,MMPvalue[match(mmr[,1],row.names(MMPvalue)),])
write.table(gs,file = paste0(baseFolder,'/wgcna_MM_GS_cor.txt')
,quote = F,row.names = F,sep = '\t')
if(ncol(cliGeneMembership)==1){
ngm=cbind(abs(cliGeneMembership[match(mmr[,1],row.names(cliGeneMembership)),]))
colnames(ngm)=colnames(cliGeneMembership)
}else{
ngm=abs(cliGeneMembership[match(mmr[,1],row.names(cliGeneMembership)),])
}
#head(ngm)
all_cr=rbind()
for(u in unique(as.character(mmr[,2]))){
#u=unique(as.character(mmr[,2]))[1]
t_inds=which(mmr[,2]==u)
if(length(t_inds)>3){
cr=as.data.frame(cor(cbind(abs(mmr[t_inds,3])),ngm[t_inds,], use = "p"));
cr_p=as.data.frame(corPvalueStudent(as.matrix(cr), length(t_inds)));
cdt=cbind(M=u,Clinical=1:ncol(ngm),t(rbind(cr,cr_p)))
colnames(cdt)=c('Module','Clinical','R','P')
all_cr=rbind(all_cr,cdt)
}else{
cdt=cbind(rep(u,ncol(ngm)),1:ncol(ngm),rep(NA,ncol(ngm)),rep(NA,ncol(ngm)))
colnames(cdt)=c('Module','Clinical','R','P')
all_cr=rbind(all_cr,cdt)
}
}
write.table(all_cr,file = paste0(baseFolder,'/wgcna_MM_GS_cor_RP.txt'),quote = F,row.names = F,sep = '\t')

}else if(method=='export'){

weight=as.numeric(unlist(data$weight))
modules=unlist(data$modules)
fileTree=as.numeric(unlist(data$fileTree))
baseFolder=unlist(data$oldFolder)
#cliDatas[1][[2]]
#table(cliDatas[,4])

#data<-jsonlite::stream_in(file(paste0(oldFolder,'/export.json')),pagesize = 1000)

#oldFolder='/pub1/data/mg_projects/projects/web_script/tool_runing/97d971bc04475222ec72f4a05e66910f'
if(fileTree==1){
al.dt=c()
for(fl in dir(oldFolder)){
if(length(grep('.json$',fl))>0|length(grep('.log$',fl))>0){
}else{
al.dt=c(al.dt,fl)
}
}
write.table(al.dt,file = paste0(opt$outfile,'/file.tree'),quote = F,row.names = F,col.names = F,sep = '\t')
}else{
file.copy(opt$infile,paste0(oldFolder,'/export.json'),overwrite = T)
#weight=0.2
#modules=c('darkgreen','turquoise');
net=tidyfst::import_fst(paste0(baseFolder,'/wgcna_module_net.fst'),as.data.table = F)
net=net[net[,3]>weight,]
#dim(net)
geneModule=tidyfst::import_fst(paste0(baseFolder,'/wgcna_module.fst'),as.data.table = F)
genes=as.character(geneModule[which(as.character(geneModule[,2])%in%modules),1])
t1.inds=which(as.character(net[,1])%in%genes)
t2.inds=which(as.character(net[,2])%in%genes)
t.inds=intersect(t1.inds,t2.inds)
if(length(t.inds)==0){
write.table(rbind(colnames(net)),file = paste0(baseFolder,'/network_edge.txt'),quote = F,row.names = F
,sep = '\t',col.names = F)
write.table(rbind(colnames(geneModule)),file = paste0(baseFolder,'/network_node.txt'),quote = F,row.names = F
,sep = '\t',col.names = F)
}else{
net=net[t.inds,]
ug=unique(c(as.character(net[,1]),as.character(net[,2])))
node=geneModule[match(ug,as.character(geneModule[,1])),]

write.table(net,file = paste0(baseFolder,'/network_edge.txt'),quote = F,row.names = F,col.names = T,sep = '\t')
write.table(node,file = paste0(baseFolder,'/network_node.txt'),quote = F,row.names = F,col.names = T,sep = '\t')
}
}

}

},error = function(e) {
print(conditionMessage(e))
logs=c(logs,paste0('error:',conditionMessage(e)))
}, finally = {
write.table(logs,file = paste0(opt$outfile,'/run.log'),quote = F,row.names = T,col.names = T,sep = '\t')
})

input.json如下

{"exp_path":"/home/win/4T/GeneDL/OSDrought_GCNAT_Link/plot/multispecies_WGCNA/indica/data/indica_CD_WGCNA.txt","geneMode":"mad","geneModeValue":"50","sampleCut":"1","netType":"unsigned","oldFolder":"","minModuleSize":"30","deepSplit":"3","mergeCutHeight":"0.25","method":"module"}

后续就可以用数据做深度学习模型了~

------ 本文结束 🎉🎉 谢谢观看 ------
0%